
Translate this page into:
Changes in speech and voice characteristics following two hours and eight hours of acute sleep deprivation

*Corresponding author: Ashok Bhimrao Warthe, Specialist in Aerospace Medicine, Institute of Aerospace Medicine, IAF, Bengaluru, Karnataka, India. ashokwarthe@gmail.com
-
Received: ,
Accepted: ,
How to cite this article: Warthe AB, Sharma V. Changes in speech and voice characteristics following two hours and eight hours of acute sleep deprivation. Indian J Aerosp Med 2022;66:15-20.
Abstract
Objectives:
Sleep loss is known to affect aircrew performance. The study intended to examine the changes in speech and voice characteristics following 2 and 8 h of sleep deprivation for their potential usage as screening methods for detecting sleep deprivation in aircrew.
Material and Methods:
In a repeated measure design, the study analyzed the effects of 2 h and 8 h of acute sleep deprivation on speech and voice parameters among 30 healthy male volunteers by analyzing standard paragraph reading for 15 s and sustained vowel/a/for 6 s using the commercially available Dr. Speech Voice assessment tool. Subjective appreciation of sleepiness and fatigue was measured by Stanford Sleepiness Scale (SSS) and Chalder’s Fatigue Scale (CFS), respectively, and objective assessment of performance by psychomotor vigilance task (PVT).
Results:
The subjective markers (SSS and CFS) and objective parameters (PVT reaction time) indicated evidence of fatigue onset even after 2-h of sleep deprivation. In speech parameters, average fundamental frequency (F0), F0 range, and % silence time decreased significantly; whereas, speech time, percent voiceless time, and mean percent voiced time increased significantly following 8-h of sleep deprivation, while percent silence time decreased significantly after 8-h of sleep deprivation . In voice parameters, shimmer % and NNE increased significantly while harmonic-to-noise ratio and signal-to-noise ratio decreased significantly after 8-h of sleep deprivation. Mean shimmer % showed a significant change even after 2-h of sleep deprivation.
Conclusion:
The findings of the study bring out significant changes in both the speech and voice spectrum following periods of acute sleep deprivation. The changes were more pronounced during sleep deprivation of 8-h as compared to 2-h. These findings have potential application in aviation environment in objective detection of aircrew fatigue following periods of continuous wakefulness and resultant sleep deprivation.
Keywords
Sleep deprivation
Sleepiness
Fatigue
Speech spectrum
Voice spectrum

INTRODUCTION
Sleep deprivation is a known contributing factor to fatigue in aircrew. In both commercial and military flight operations, unpredictable work hours, long duty periods, circadian disruptions, and insufficient sleep have all been related to aircrew fatigue.[1] Early identification of sleep deprivation has been the focus of research to prevent sleep-deprived pilots from flying. In the past, significant work has been done on technology development for the identification of sleep deprivation. In these endeavors, electrode-based (electrooculography/electroencephalography/blink rate, etc.), video-based equipment (PERCLOS), and other technologies have been used.[2] Although sleep loss has been identified to some extent using these methods, their use in an aviation setting has not been successful. In contrast to these electrode-based or video-based technologies, speech and voice characteristics have also been suggested as indicators of sleep loss.[3]
Contactless measurements such as speech and voice analysis are non-intrusive (they do not interfere with the primary flying activity) and have the advantage because wearable sensors generate discomfort, additional stress, and often decrease working capabilities and mobility demands. Furthermore, speech is simple to capture even in harsh environments (strong light, high humidity, and temperature), requires only inexpensive, long-lasting, and maintenance-free sensors, and, most crucially, it makes use of existing communication system hardware. In addition, speech data are ubiquitous in the cockpit. Given these unambiguous benefits and the acceleration of computer processing, computational studies of speech and voice expressions have rekindled considerable interest.
Sleep loss intensifies the sense of sleepiness, induces confusion, and decreases vigor. As little as, 2–3-h of sleep loss on a single night can lead to measurable degradation in performance. At more than 40 h without sleep, the resulting cognitive impairment can be both intense and debilitating.[4] Hartzler[5] demonstrated that 24 h of continuous wakefulness was linked to a significant decline in measures of reasoning and vigilance. Anecdotally, in most cases, sleep loss during a normal day for an aircrew lasts between 1 and 2 h. Any impairment is exacerbated by the fact that exhausted people are often unaware of how much their performance has deteriorated, leading them to believe they are safe to fly when they are not.
The purpose of this research was to observe how sleep deprivation affected speech and voice features after 2-h and 8-h of sleep deprivation. The 2-h sleep loss corresponds to a likely occurrence of sleep loss in an aircrew on a daily routine and 8-h to an overnight sleep loss during a sustained operation. The outcomes of the study could help to determine whether speech and voice characteristics can be used as a screening tool for detecting sleep deprivation in aircrew.
MATERIAL AND METHODS
The study was approved by the Institute Ethics Committee of the Institute of Aerospace Medicine (IAM), Bengaluru and was carried out in the Department of Applied Physics on weekends after written informed consent from 30 young, healthy Indian male volunteers aged between 20 and 45 years with a mean of 32.3 ± 5.47 years. Subjects with a history of sleep disorders, ear, nose, and throat ailments affecting speech, depression, anxiety, epilepsy, or other Central Nervous System diseases affecting sleep, and any history of drug/substance abuse were excluded from the study. A Sleep Diary and Pittsburgh Sleep Quality Index (PSQI) were given to each subject to note their sleep pattern and the quality of sleep was assessed. Participants were thoroughly briefed about not consuming alcoholic beverages and restricting themselves with their routine intake of caffeinated drinks or smoking before and during the test. Participants were briefed to wake up at 0600h on the day of experimentation following a comfortable sleep the previous night and report to the laboratory within 1 h.
At 0700h, speech and voice spectrum of participants was recorded. A standardized paragraph “Cessna nine three four five Lima, county tower, runway two four in use, enter traffic pattern, report left base, wind calm, altimeter three zero point zero eight” was given for recording of speech spectrum for a fixed time interval of 15 s. The voice spectrum was recorded from the pronunciation of a simple vowel/a/for 6 s. Both the samples were analyzed using commercially available Dr. Speech Voice assessment software developed by Dr. Speech Sciences (Tiger Industries Inc.) in real-time with one channel recording of voice signal using a unidirectional high-quality condenser microphone and preamplifier. This recording of speech and voice spectrum was considered as baseline. The speech was analyzed for average fundamental frequency (F0), F0 range, % speech time, and % silence time. The voice output parameters included hoarseness, harshness, or breathy voice.
Participants carried out their routine activities the whole day and were instructed to abstain from daytime sleeping. They reported back to the laboratory at 2200h after having food and the second speech and voice samples were recorded 2 h after their usual time to sleep as per the sleep diary corresponding to 2 h of sleep deprivation. Following that, the participants were subjected to force wakefulness which was monitored continuously. During this period, participants could watch movies, play games, and do recreational activities. The third speech and voice spectrum were repeated following 8 h of sleep deprivation from their usual time to sleep as per the sleep diary. Psychomotor vigilance task (PVT) reaction time was recorded at baseline, after 2 h and 8 h of sleep deprivation. Subjective sleepiness and fatigue were assessed by documenting participants’ feedback using Stanford Sleepiness Scale (SSS) and Chalder’s Fatigue Scale (CFS).
Data were analyzed using Professional Statistical Software Statistica 8.0. One-way repeated measure ANOVA was carried out to analyze the continuous interval data and post hoc analysis by the Bonferroni test for individual comparisons. Friedman ANOVA was carried out to analyze ordinal data and the Wilcoxon Signed-Rank test was carried out for individual comparison. The significance level was set at P < 0.05.
RESULTS
The PSQI showed a mean and median global score of 3.63 and 4.5, respectively, indicating no difficulty of the participants in sleep and thus ruling out any existing sleep disorders.
[Figure 1] shows that SSS clubbed together for different times of day increased significantly in the afternoon (2.4) and night (3.9) (Biphasic rise) (P < 0.001).
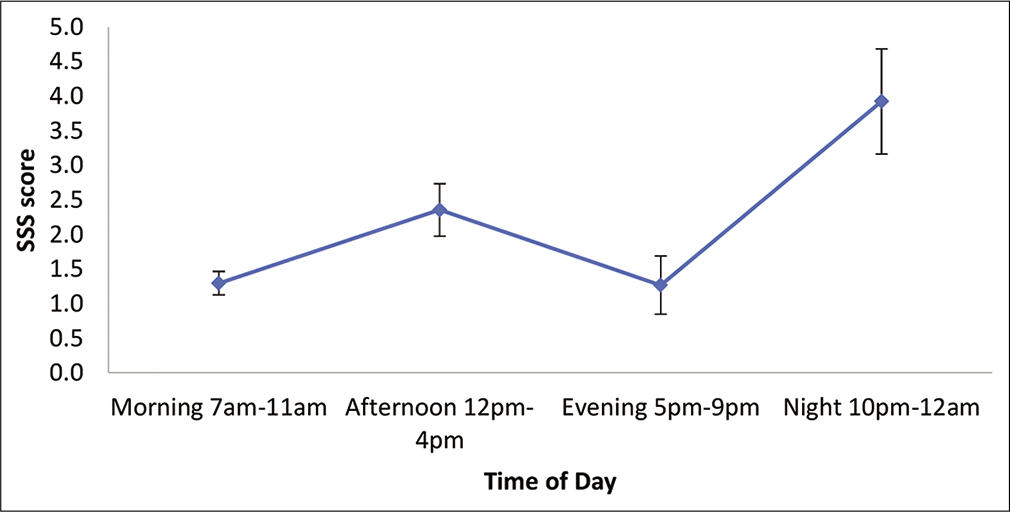
- Average SSS score during different phases of the day. Vertical bars represent ± 1SD from the mean.
Physical and psychological fatigue scores by Chalder’s Fatigue Scale (indicated by Q1–Q7 and Q8–Q11) increased significantly from baseline (Chi-square by Friedman test 58.06 and 48.078; P < 0.001) as shown in [Figure 2].

- CFS score after 2 h and 8 h of sleep deprivation. Vertical bars represent ± 1SD from the mean.
The mean reaction time on PVT as shown in [Figure 3] increased significantly after continuous wakefulness (F = 118.092 and P = 0.000). Post hoc analysis using the Bonferroni test revealed that 2 h of sleep deprivation led to a statistically significant (P = 0.039) increase in mean reaction time from baseline. Post-8-h of sleep deprivation and the mean reaction time increased significantly as compared to baseline (P = 0.020) as well as 2-h of sleep deprivation (P = 0.059).
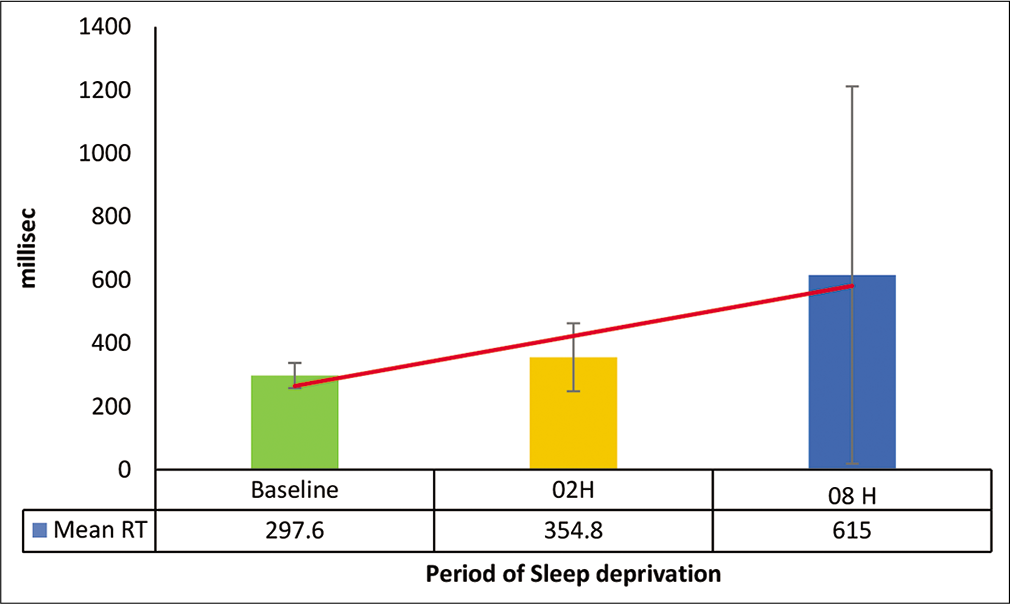
- Mean reaction time of PVT after sleep deprivation.
[Figure 4] shows that the mean lapses > 500 ms on PVT increased significantly after continuous wakefulness (F = 23.455 and P = 0.000). Post hoc analysis by the Bonferroni test revealed a statistically significant difference only after 8 h of sleep deprivation as compared to baseline (P = 0.028). No significant difference was observed between baseline and 2-h sleep deprivation (P = 0.154) and between 2-h and 8-h of sleep deprivation (P = 0.061).
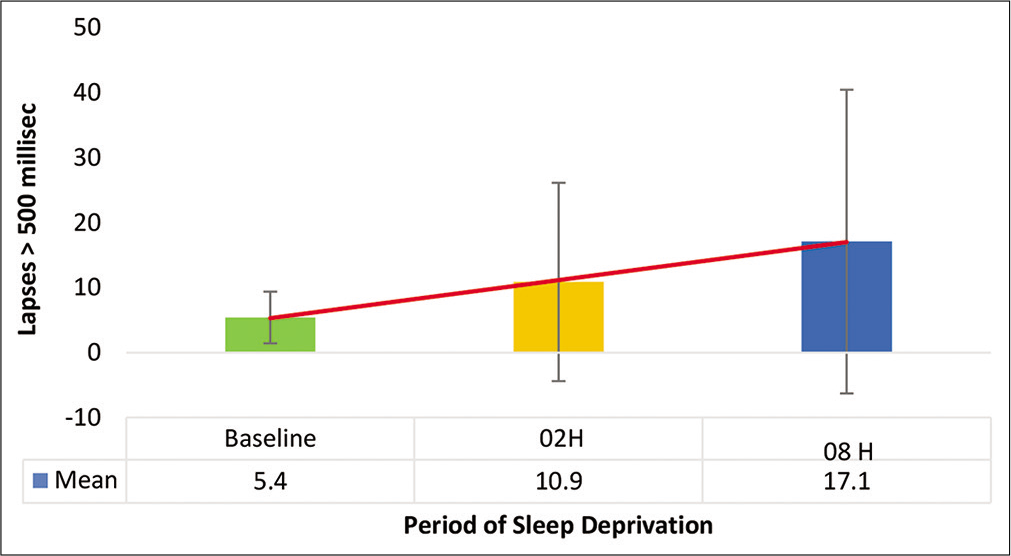
- Lapses > 500 ms on PVT test.
Mean ± SD, range values, and differences of speech parameters between baseline, 2-h, and 8-h of sleep deprivation are presented in [Table 1].
| Voice Parameters | Time | Mean | Std Dev | Std. Error | Range | 95% CI | P value | |
|---|---|---|---|---|---|---|---|---|
| Lower | Upper | |||||||
| Avg F0 | Baseline | 152.6 | 42.09 | 7.68 | 233.5 | 136.9 | 168.3 | |
| 2-h | 135.9 | 19.51 | 3.56 | 72.4 | 128.7 | 143.2 | 0.109 | |
| 8-h | 131.9 | 19.48 | 3.55 | 80.2 | 124.7 | 139.2 | 0.032* | |
| F0 Range | Baseline | 197.2 | 235.46 | 42.99 | 750.6 | 109.3 | 285.2 | |
| 2-h | 71.8 | 34.48 | 6.29 | 120.9 | 58.9 | 84.7 | 0.023* | |
| 8-h | 69.1 | 39.82 | 7.27 | 139.6 | 54.2 | 83.9 | 0.020* | |
| % Speech Time | Baseline | 38.20 | 19.33 | 3.52 | 65.8 | 30.9 | 45.4 | |
| 2-h | 83.37 | 191.38 | 34.94 | 1079.6 | 11.9 | 154.8 | 0.645 | |
| 8-h | 48.86 | 20.35 | 3.71 | 82.8 | 41.2 | 56.4 | 0.022* | |
| % Silence Time | Baseline | 61.79 | 19.33 | 3.52 | 65.8 | 54.5 | 69.0 | |
| 2-h | 52.65 | 19.66 | 3.59 | 88.5 | 45.3 | 60.0 | 0.065 | |
| 8-h | 51.13 | 20.35 | 3.71 | 82.8 | 43.5 | 58.7 | 0.022* | |
| % Voiceless Time | Baseline | 24.50 | 3.92 | 0.71 | 22.2 | 8.8 | 12.6 | |
| 2-h | 10.73 | 5.00 | 0.91 | 28.1 | 11.4 | 16.6 | 0.066 | |
| 8-h | 14.05 | 6.89 | 1.25 | 24.8 | 11.8 | 16.6 | 0.027* | |
*P<0.05
The mean shimmer % on voice analysis increased significantly after 2-h and 8-h of sleep deprivation (F = 196.603 and P = 0.000) as shown in [Figure 5]. Post hoc analysis revealed a significant difference between baseline and 2-h of sleep deprivation (P = 0.015) and 8 h of sleep deprivation (P = 0.002).
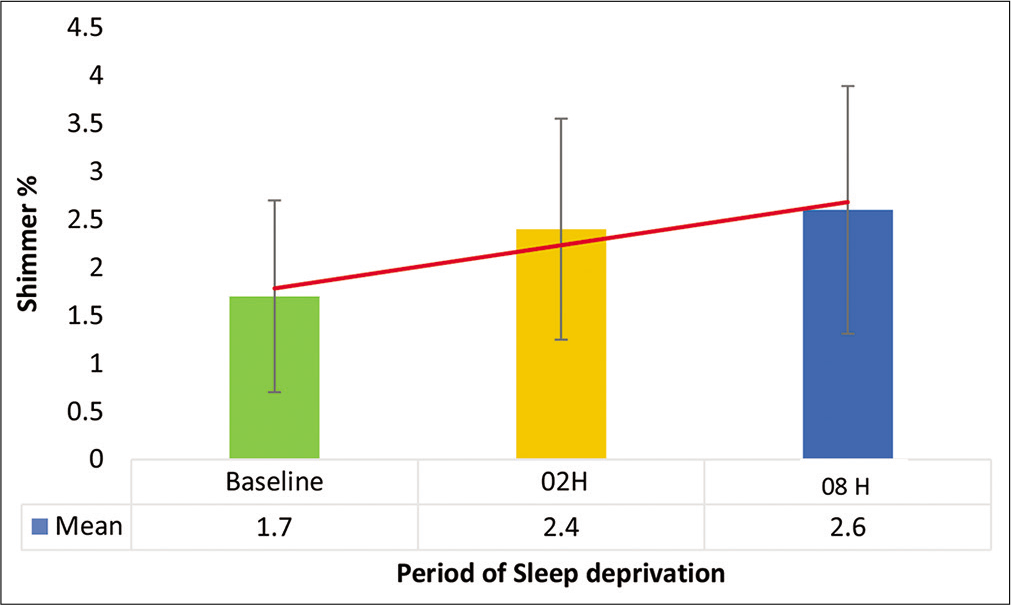
- Mean shimmer % after 2-h and 8-h sleep deprivation.
The mean normalized noise energy (NNE) increased significantly after sleep deprivation (F = 367.027 and P = 0.000) as shown in [Figure 6]. Post hoc analysis of NNE showed a statistically significant difference after 8-h of sleep deprivation (P = 0.013). However, no significant difference was observed between baseline and 2-h as well as between 2-h and 8-h of sleep deprivation (P > 0.05).
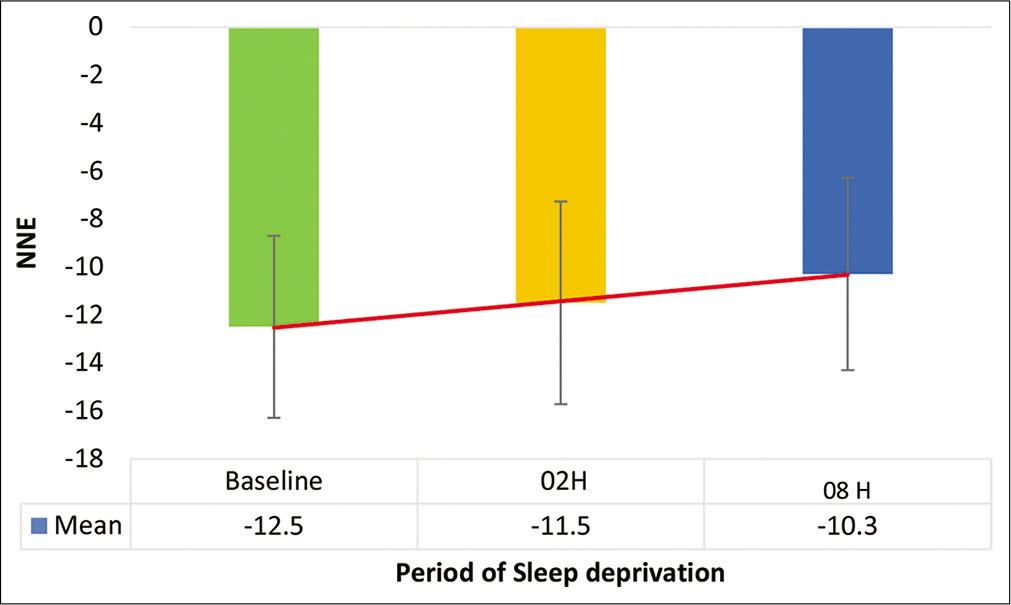
- NNE on voice analysis after 2-h and 8-h sleep deprivation.
The mean harmonic-to-noise ratio (HNR) decreased significantly after sleep deprivation (F = 2017.651 and P = 0.000) as shown in [Figure 7]. Post hoc analysis of HNR showed a significant difference only after 8 h of sleep deprivation as compared to baseline (P = 0.020) and no significant difference between baseline and 2 h and between 2 h and 8 h of sleep deprivation (P > 0.05).
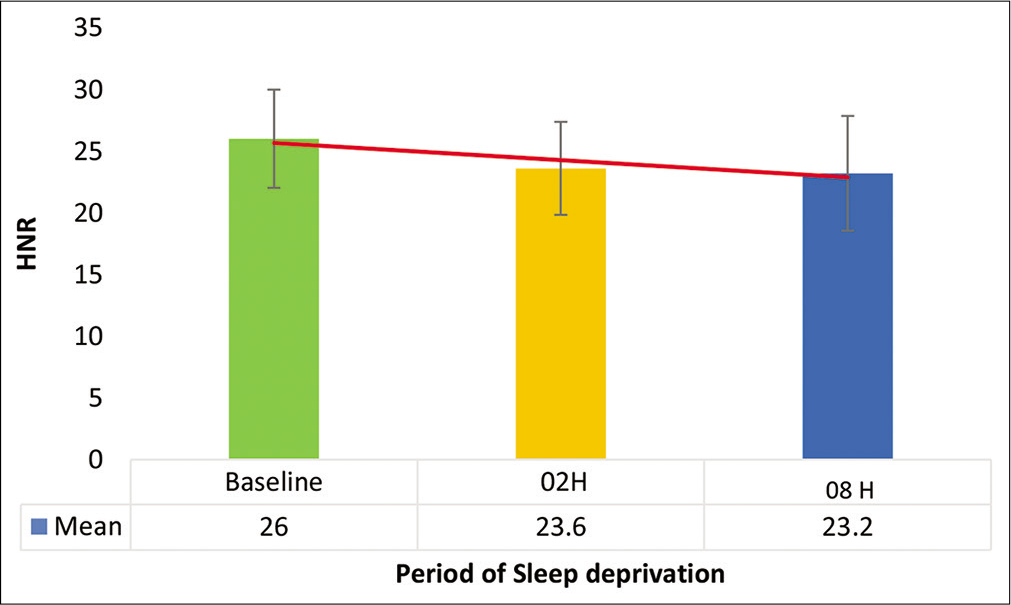
- Harmonic-to-noise ratio after 2-h and 8-h sleep deprivation.
The mean signal-to-noise ratio (SNR) on voice analysis decreased significantly after sleep deprivation (F = 1867.082 and P = 0.000) as shown in [Figure 8]. Post hoc analysis of SNR revealed a significant difference after 8-h of sleep deprivation as compared to baseline (P = 0.018) and no significant difference between baseline and 2-h as well as between 2-h and 8-h of sleep deprivation (P > 0.05).
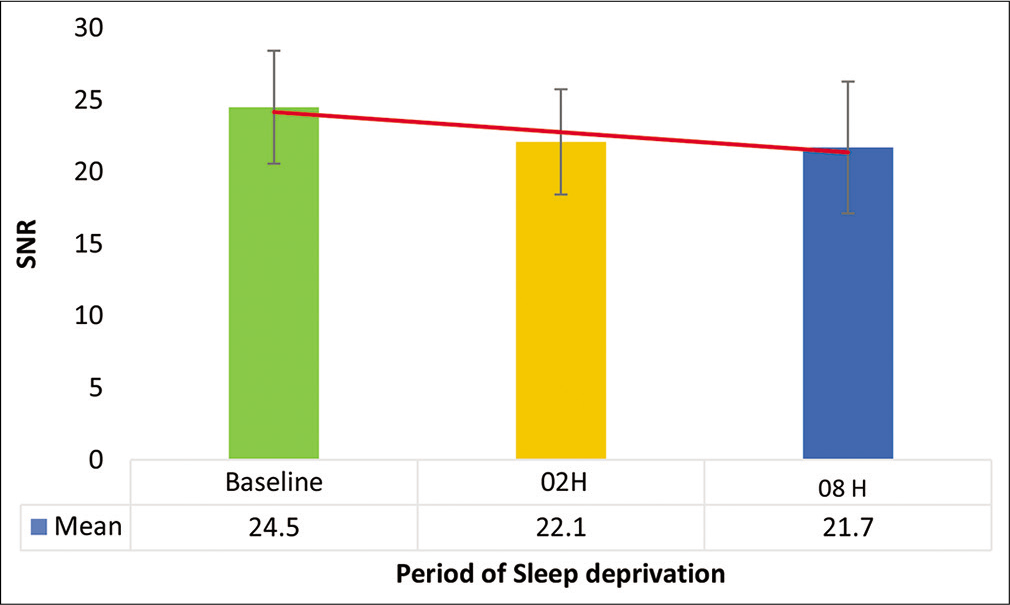
- Signal-to-noise ratio after 2-h and 8-h sleep deprivation.
Multiple regression analysis between performance changes and voice changes at baseline, 2-h and 8-h of sleep deprivation did not reveal any significant association with a correlation value of <0.1.
DISCUSSION
The purpose of this study was to investigate the changes in speech characteristics of 30 healthy male participants following 2-h and 8-h of sleep deprivation. In this study, subjective and objective markers of fatigue, including SSS, CFS, and PVT reaction time, indicated evidence of fatigue onset even after 2-h of sleep deprivation. This confirmed the existence of induced fatigue, allowing researchers to examine the effects of sleep deprivation on speech and voice in these time settings.
Speech characteristics
Voiced, unvoiced, and silence are the three broad categories of speech sounds.[6,7] The voiced portion is periodic in the time domain and harmonics in the frequency domain. The expiratory air is interrupted by the vibrating vocal cords, periodically producing a glottal wave that is modulated by the articulatory organs, resulting in voiced speech. The unvoiced region of speech has random noise like a non-periodic waveform in the time domain only and is not interrupted by the vibrating vocal cords. The voiced and unvoiced speech is separated by the silence region with no speech output as no air is supplied to the vocal tract.[7]
The speech characteristics are determined by an average fundamental frequency (f0), f0 range, % speech, time, %silence time, and %voiceless time.[7] Average fundamental frequency (f0) is the lowest frequency component of a complex periodic waveform of speech. Bagnall et al. found that average fundamental frequency decreased with sleep deprivation.[8] However, Vogel et al.[9] have reported no change in fundamental frequency whereas Whitmore and Fisher observed that the fundamental frequency fluctuated throughout the sleep deprivation.[10] In the present study [Table 1], the average f0 decreased significantly after 8-h of sleep deprivation and the mean f0 range showed a significant decrease after both 2-h and 8-h of sleep deprivation as compared to baseline. This can be attributed to the increase in the unvoiced (noise) component of the voice and softening of the vocal tract walls as a result of a decrease in vocal fold tension, stiffness and viscosity, and lowering of velum due to fatigue caused by sustained wakefulness.
Reduced muscle stress and body temperature due to fatigue resulting from sleep deprivation affect respiration, phonation, articulation, and radiation, which, in turn, decreases the voice quality causing perturbation in waveform amplitude or shimmer. This has been suggested by Whitmore and Fisher[10] as a potential indicator of sleep deprivation as it helps in yielding finer changes in voice. In the present study, the mean shimmer % showed a significant change even after 2-h of sleep deprivation. This can be potentially applied to detect sleep deprivation during periods of continuous wakefulness in military aviation, wherein early detection of fatigue is critical.
Audio recording analysis during an in-depth accident analysis of a Brazilian aircraft by the Centre for Investigation and Prevention of Aeronautical Accidents revealed increased hesitations, silent pauses in between the speech, prolongation of final syllables, and their articulation rate. From the analysis, it was suggested that objective measures of the temporal organization of speech were affected due to sleepiness and fatigue.[3] In our study, fatigue due to 8-h of acute sleep deprivation affected the speech planning and neuromuscular motor coordination processes, which, in turn, slowed down the speed resulting in increased speech duration causing a significant increase in speech time and percent voiceless time as well as a significant decrease in percent silence time and mean percent voiced time.
Voice characteristics
The HNR is defined as “the amplitude of tonal relative to noise components,” which indicates that if a signal’s tonal components have a greater amplitude while the noise components remain unchanged, the HNR will increase.[11] It is a ratio of harmonic energy and noise energy that is utilized as a practical index of the degree of hoarseness, according to Sasaki et al.[12] The HNR decreased significantly in the present study, indicating that the vocal functioning was becoming less efficient as a result of 8-h of acute sleep deprivation.
NNE is a measure of the turbulent noise energy produced during vocalization and is obtained using a comb filter. It is calculated by subtracting the harmonic signal energy from total vocal energy and is more sensitive to glottal noise detection, making it more useful in distinguishing disordered voices from normal voices.[13] After 8-h of sleep deprivation, NNE increased significantly, indicating increased breathiness and glottal noise emission as a result of decreased glottal resistance.
The SNR is the ratio of signal-to-noise extraction on the power spectrum graphic display of the vocal wave, derived using the Fast Fourier Transform. SNR, according to Kojima et al., is a quantitative indication of hoarseness severity, providing objective information on the efficacy of individual treatment.[14] SNR on speech analysis decreased significantly after 8 h of acute sleep deprivation in the present study, indicating increased breathiness of the voice and higher glottal noise emission due to fatigued vocal cord muscle tension.
Jitter is the cycle-to-cycle variability or perturbation of the pitch period or fundamental frequency. Percent jitter is most accurately measured in a sustained vowel such as/a/which is primarily affected by the lack of control of vibration of the vocal cords. A higher percentage of jitter has been noted in patients with pathological vocal conditions.[15] In our study, the mean jitter % after sleep deprivation was not significant as all our participants were healthy and not suffering from any vocal pathology.
Since only 8-h of sleep deprivation was used, the qualitative patterns observed in the data should be interpreted with caution. In the future, it is recommended to use more than 8-h of sleep deprivation to establish more distinct patterns in the data and, hopefully, more significant effects on the variables explored. In addition, the study enrolled solely male individuals. Thus, a diverse sample of individuals, including females, would enhance the database’s value. The study is a first step in utilizing speech and voice, a ubiquitous but understudied aspect of the aviation environment. The initial results have been encouraging. Further research may open the road for real-time speech analysis to be used to interpret fatigue components during flight.
CONCLUSION
The study analyzed the effects of 2-h and 8-h of acute sleep deprivation on speech and voice parameters by analyzing standard paragraph reading for 15 s and sustained vowel/a/ for 6 s using the commercially available Dr. Speech Voice assessment tool. The findings of the study clearly bring out significant changes in both the speech and voice spectrum following periods of acute sleep deprivation. The changes were more pronounced during sleep deprivation of 8 h as compared to 2 h. These findings have potential application in the aviation environment in the objective detection of aircrew fatigue following periods of continuous wakefulness and resultant sleep deprivation.
Acknowledgment
The author acknowledges Dr. Savita Gaur Sc “E,” who during her tenure as HoD Applied Physics, IAM IAF provided valuable guidance in undertaking the study.
Declaration of patient consent
The authors certify that they have obtained all appropriate patient consent.
Financial support and sponsorship
Nil.
Conflicts of interest
There are no conflicts of interest.
References
- Spectral analysis of EEG during microsleep events annotated via driver monitoring system to characterize drowsiness. IEEE Trans Aerosp Electron Syst. 2020;56:1346-56.
- [CrossRef] [Google Scholar]
- Speech analysis for fatigue and sleepiness detection of a pilot. Aerosp Med Hum Perform. 2019;90:415-8.
- [CrossRef] [PubMed] [Google Scholar]
- Sleep deprivation: Impact on cognitive performance. Neuropsychiatr Dis Treat. 2007;3:553-67.
- [Google Scholar]
- Fatigue on the flight deck: The consequences of sleep loss and the benefits of napping. Accid Anal Prev. 2014;62:309-18.
- [CrossRef] [PubMed] [Google Scholar]
- Acoustic sleepiness detection: Framework and validation of a speech-adapted pattern recognition approach. Behav Res Methods. 2009;41:795-804.
- [CrossRef] [PubMed] [Google Scholar]
- Some vocal consequences of sleep deprivation and the possibility of “Fatigue Proofing” the voice with Voicecraft® voice training. J Voice. 2011;25:447-61.
- [CrossRef] [PubMed] [Google Scholar]
- Acoustic analysis of the effects of sustained wakefulness on speech. J Acoust Soc Am. 2010;128:3747-56.
- [CrossRef] [PubMed] [Google Scholar]
- Quantitative acoustic measurements for characterization of speech and voice disorders in early untreated Parkinson's disease. J Acoust Soc Am. 2011;129:350-67.
- [CrossRef] [PubMed] [Google Scholar]
- Quantitative analysis of hoarseness using a digital sound spectrograph. J Voice. 1991;5:36-40.
- [CrossRef] [Google Scholar]
- Normalized noise energy as an acoustic measure to evaluate pathologic voice. J Acoust Soc Am. 1986;80:1329-34.
- [CrossRef] [PubMed] [Google Scholar]
- Computer analysis of hoarseness. Acta Otolaryngol. 1980;89:547-54.
- [CrossRef] [PubMed] [Google Scholar]
- Accuracy of jitter and shimmer measurements. Procedia Technol. 2014;16:1190-9.
- [CrossRef] [Google Scholar]


