Translate this page into:
Lipid Profile Analysis of Aircrew
-
Received: ,
Accepted: ,
Abstract
Most laboratories including all our Armed Forces Centers, estimate Low Density Lipoproteins Cholestorol (LDL-C) levels with the Friedewald formula, based on the concentrations of Total Cholesterol, the cholesterol present in High-Density Lipoproteins Cholestorol (HDL-C), and Triglycerides. The use of that formula has severe limitations. This study aimed to compare the estimation of LDL-C levels using the Friedewald formula with direct homogenous method in samples of aircrew coming for medical evaluation at Institute of Aerospace Medicine. The measurements of TC, HDL and TG were performed using traditional enzymatic methods. The measurements of LDL-C were performed using direct methods with no precipitation and the estimation of the LDL-C fraction was also calculated using the Friedewald formula. The mean LDL-C Friedewald (120.09±27.15 mg/dl) was higher than LDL-C Direct (112.35±29.76 mg/dl) in the fasting samples and the difference was statistically significant (p value<0.0034). A similar significant difference was seen in the diabetics. LDL-C direct values in fasting and postprandial samples were similar (p value <0.40) whereas the LDL-C Friedewald was significantly different in the both fed and fasting states (p value<0.033). There was a significant positive bias by using LDL-C Friedewald method in samples with TG<150 and in 150-200 group. The difference became insignificant as TG increased and above 300 mg/dl the bias became negative. The use of calculated LDL-C values by Friedewald formula, for TG<400 can be continued keeping in mind that the calculated method changes the risk stratification of the patient. For all cases of aircrew that are on lipid lowering drugs, direct methods should be used. Also direct methods will be essential in cases with TG >400mg/dl and diabetics who cannot endure long hours of fasting.
Keywords
LDL Cholesterol
Friedewald formula

Introduction
Coronary Artery Disease (CAD) accounts for the greatest number of deaths of adult individuals worldwide. Research from experimental animals, laboratory investigations, epidemiology, and genetic forms of hypercholesterolemia indicate that elevated Low Density Lipoprotein Cholesterol (LDL-C) is a major cause of Coronary Heart Disease (CHD). In addition, recent clinical trials robustly show that LDL-C lowering therapy reduces risk for CHD. For these reasons, Third Report of the National Cholesterol Education Program (NCEP) Expert Panel on Detection, Evaluation, and Treatment of High Blood Cholesterol in Adults i.e., Adult Treatment Panel III (ATP III ) continues to identify elevated LDL-C as the primary target of cholesterol-lowering therapy(1). As a result, the primary goals of therapy and the cut points for initiating treatment are stated in terms of LDL. The levels of LDL cholesterol recommended are: Optimal, <100mg/dl; near optimal or above optimal, 100-129mg/dl; Borderline high, 130-159 mg/dl; High, 160-189 mg/dl; very high,>190mg/dl [1].
The reference method for determining LDLC is b-quantitation [2] which requires ultracentrifugation of the samples, which is not feasible in laboratory routine. Therefore, most laboratories including all our Armed Forces Centers, estimate LDL-C levels with the Friedewald formula, based on the concentrations of total cholesterol, the cholesterol present in High-Density Lipoproteins (HDL-C) and triglycerides [3]. However, the error of determining LDL-C through that estimation comprises the addition of the analytical errors of the three parameters used in the calculation. In addition, the use of that formula has severe limitations and cannot be applied to samples containing triglyceride (TG) levels > 400 mg/dL, to samples with chylomicrons and to samples of patients with dysbetalipoproteinemia (Fredrickson Type III) [4]. Some authors have demonstrated that that formula should not be used in certain groups of patients, such as patients with diabetes, hepatic diseases, or nephropathies, even with triglyceride levels < 400 mg/dL [5]. Increased synthesis of lipoproteins in liver, abnormal transport of circulating lipid particles with lipiduria are possible reasons postulated in nephropathies. More importantly, fall in calculated LDL values is much more as compared to direct methods when patients are on lipid lowering drugs and does not reflect changes in Lp(a) levels[6].
Recently, several homogeneous methods have been developed by different manufacturers for the direct measurement of LDL-C levels. These methods not only directly estimate the LDL cholesterol and eliminate the interference of triglyceride levels but can also be done on patients who have difficulty in complying with the 12-14 hrs fasting requirement. This further helps eliminate scheduling and compliance problems. This study aimed to compare the estimation of LDL-C levels using the Friedewald formula with direct homogenous method in samples of aircrew coming for medical evaluation at IAM.
Material & Methods
This study assessed the blood samples of 108 consecutive cases of aircrew, which were referred to Dept. of Aviation Pathology & Toxicology at IAM for lipid profile. Blood samples were collected after 12 to 14 hr fast. 2 hr post-prandial samples were also collected to evaluate the direct assay and calculated method in samples having varying triglyceride levels and compare the results in fasting and fed states. The serum was separated and the assays were performed on the same day of sample collection.
The measurements of the triglycerides, HDL Cholesterol and total cholesterol were performed with the kits manufactured by Transasia Biomedicals Ltd (In technical collaboration with ERBA diagnostics Mannheim, Germany) according to the specifications of the manufacturers, in ERBA Chem 5 semi autoanalyser. The triglycerides were measured enzymatically by use of Glycerol kinase and glycerol phosphate oxidase method, the total cholesterol by Cholesterol-oxidase and peroxidase method and the HDL cholesterol was measured after using a precipitating agent (phosphotungstate and magnesium).
The LDL-C measurement with the homogeneous method was performed with the kits manufactured by Transasia Biomedicals Ltd. The method is based on the selective protection of LDLC with the addition of reagent R1 (Good’s buffer, pH 6.8, 25 mmol/l cholesterol oxidase 5000 U/L, N-(2-hydroxy-3-sulfopropyl)-3,5-dimethoxyaniline (H-DAOS) 0.64 mmol/l , catalase 10000 U/L and Ascorbate oxidase 5000 U/L) . The cholesterol of the other lipoproteins is processed by cholesterol oxidase, and the hydrogen peroxide formed is broken down by catalase.
After 5 minutes, with the addition of reagent 2 (Good’s buffer, pH 7.1, 25 mmol/l, 4-aminoantipyrine 3.4 mmol/l, peroxidase 20,000U/ L), LDL-C is released for enzymatic processing and yields a blue colour complex with HDAOS and 4 aminoantipyrine, which is measured at 600 nm.
The concentration in sample was compared with the absorbance of the LDL calibrator. All reagents are stable fluids. The tests were done on ERBA Chem 5 semi autoanalyser.
The calculated LDL-C level was estimated using the Friedewald formula: LDL-C = TC – HDL-C – (TG/5) [3] The comparison between the LDL-C measurement methods, homogeneous and estimation through the Friedewald formula, was analysed statistically using student t test and results with p value <0.05 was considered significant.
Results
Of the 108 cases of aircrew studied, 17 cases had Diabetes mellitus (DM), 3 cases had dyslipidemia and were on treatment for it and 5 cases had obesity (BMI> 30).The summary of measurements on fasting samples is given in Table 1.
| Total Cholesterol (mg/dl) | Serum Triglycerides (mg/dl) | LDL-C,Direct (mg/dl) | LDL-C, Friedewald (md/dl) | HDL-C (mg/dl) | |
|---|---|---|---|---|---|
| Fasting | 193.48±39.63 | 167.91±70.11 | 112.35±29.76 | 120.09±27.15 | 41.68±8.1 |
| Post prandial | 196.66±38.77 | 182.24± 77.20 | 112.944 ± 28.772 | 116.48 ± 30.94 | 43.48 ± 8.41 |
The mean LDL- C Friedewald (120.09±27.15 mg/dl) was higher than LDL- C Direct (112.35± 29.76 mg/dl) in the fasting samples and the difference was statistically significant (p value <0.0034). The 2 hr postprandial samples were further analysed to study the effect of food on LDL cholesterol levels and it was found that the LDL C values by Friedewald formula (116.48 ± 30.94 mg/ dl) was again higher than the LDL-C Direct (112.944 ± 28.772 mg/dl). This difference was also statistically significant (p value<0.07). The LDL-C, direct values in the fasting and PP samples were similar and the difference was not statistically significant (p value <0.40). However there was a significant difference in the LDL-C, Friedewald values in the fasting and PP samples (p value <0.033), the decrease mainly due to the increase in the triglyceride levels in the postprandial state.
The 17 diabetics were analysed separately and their LDL-C values by Friedewald formula (113.78 ± 24.25 mg/dl) was again higher than the LDL-C, Direct (108.52 ±23.30 mg/dl), this difference being statistically significant (p<0.04).
All the fasting and postprandial samples were together analysed based on their triglyceride levels and finding are summarized in Table 2.There were only 4 cases with triglyceride levels >400mg/ dl, the numbers being less, were not statistically analysed.
| Serum (mg/dl) | Triglycerides | Total Cholesterol (mg/dl) | LDL-C (mg/dl) | Direct Friede LDL-C wald (md/dl) | HDL-C (mg/dl) |
|---|---|---|---|---|---|
| <150mg/dl | n=89 | 186.01± 36.09 | 109.07±25.91 | 119.05±26.86 | 42.82±7.74 |
| 150-200 mg/dl | n=64 | 207.65±40.07 | 120.45±31.21 | 127.73±29.21 | 47.81±9.56 |
| 200-300 mg/dl | n=57 | 210.14±38.62 | 111.75±30.98 | 112.04±30.77 | 49.45±9.53 |
| 300-400mg/dl | n=11 | 203.44±36.57 | 96.1±27.23 | 94.266±13.402 | 48.77±8.33 |
| >400 mg/dl | n=4 | 229±13.22 | 127.8±13.37 | 120.25±13.77 | 56.25±6.99 |
It is seen that the calculated LDL-C Friedewald levels were more than the LDL-C direct levels and the difference was statistically significant at Triglycerides<150 mg/dl and TG between 150-200 mg/dl. (p<0.002 and P<0.005). In cases with TG between 200-300 mg/dl and 300-400mg/dl, although the LDL-C Friedewald was higher the difference was not significant. At TG levels >400mg/dl the LDL-C Friedewald was lower than direct levels.
Regression analysis was performed in all subclasses of triglycerides and a positive correlation of 0.3, 0.5, 0.7 and 0.6 was seen in TG groups <150mg, 150-200mg, 200-300mg and 300-400mg respectively. Best correlation was seen in the 200-300mg/dl group (Figure 1).
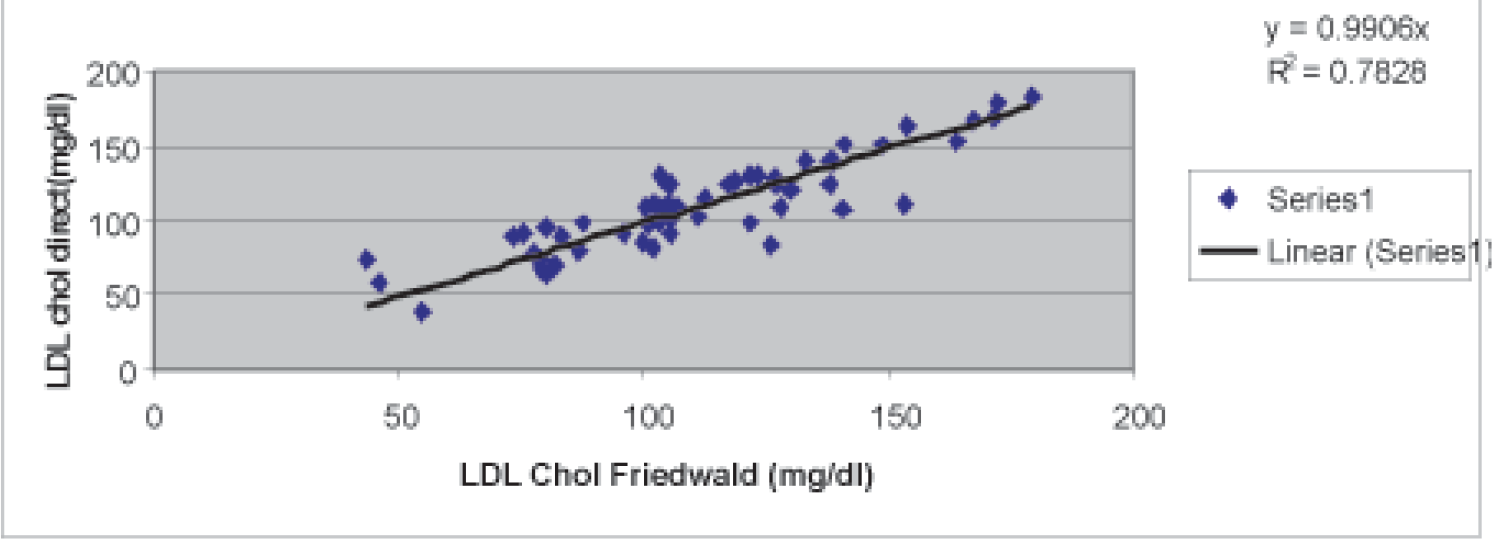
- Comparison of LDL Chol direct with LDL friedwald in samples having TG between 200-300 mg/dl
Discussion
This study aimed at assessing the performance of a homogeneous method for direct LDL-C measurement, as compared with the LDL-C estimate by using the Friedewald formula. Despite the newer direct methods, the Friedewald formula continues in most of our armed forces laboratories, mostly because of cost constrains. The Friedewald formula has been recommended for samples with triglyceride levels up to 400 mg/dL and for TG levels >400mg/dl, direct methods have been recommended. However, as already reported by other authors [7-10] and ourselves, the homogeneous methods and the Friedewald formula are not capable of providing identical results even at lower levels of triglyceride. This conclusion is also evident when the results of the samples of this study are analyzed according to their triglycerides. LDL-C Friedewald overestimated the values as compared to LDL-C Direct in all the samples of TG<300mg/dl, the difference being significant at TG<150 and TG between 150-200mg/dl.
With triglyceride levels up to 150 mg/dL, the Friedewald formula overestimated the values by a mean difference of 9.98 mg/dl as compared to the direct method. Therefore, theoretically, even without statistical significance, a patient with triglycerides < 150 mg/dL and an LDL-C level of 125 mg/dL, by using the direct method, could have an LDL-C level estimated through the Friedewald formula of 134.98 mg/dL .That hypothetical patient would pass from a desirable LDL-C value to a borderline value. This shows that measurement of LDL-C by Friedewalds definitely modifies the risk stratification of the patients. Cordova et al [11] in their study found a mean positive bias of 14 ± 13 mg/dL for the Friedewald formula with triglyceride levels up to 150 mg/dL, for triglyceride levels between 151 and 200 mg/dL, that bias decreased to 7 ± 14.5 mg/dL, and, for triglyceride levels between 201 and 300 mg/dL, that bias almost did not exist (2 ± 15.3 mg/ dL). However in the samples with triglyceride levels between 301 and 400 mg/dL that bias of the Friedewald formula became negative, with a mean deviation of -16 ± 19.4 mg/dL. In our study there was a significant overestimation in samples with TG<150 and in 150-200 group by the Friedewald formula. The difference became insignificant as TG increased with best correlation seen at 200-300mg/ dl group and above 400mg/dl the bias became negative.
The reason for the difference in the two methods could be that the Friedewald formula standardizes the value of the VLDL fraction as the triglyceride level divided by 5. However, the particles found in patients with hypertriglyceridemia (Types IIb, III, IV, and V) are usually a heterogeneous mixture of remaining chylomicrons, VLDL and remaining VLDL (IDLs). As is already known, the triglyceride/cholesterol ratio varies a lot within that range of particles. According to our results, the LDL-C estimate through the Friedewald formula has good performance in samples with triglyceride levels between 200 and 400 mg/dL, as compared with the direct method. Even in this range, the Friedewald formula may erroneously classify up to 25% of the patients with triglyceride levels between 301 and 400 mg/dL (08). That percentage may be even higher, depending on the method used for measuring HDL-C levels.
Our study has shown insignificant difference in the direct LDL-C values in fasting and post-prandial samples. Therefore the direct method has an advantage in those cases where 12-14 hr fasting may not be possible like diabetics and for scheduling those patients who have not fasted adequately.
In conclusion, the use of calculated LDL-C values by Friedewald formula, which is in use in most of our Armed Forces, for TG<400 can be continued for routine screening keeping in mind the cost of direct methods. However, it must be kept in mind the calculated method changes the risk group of the patient. So all those cases of aircrew where the results of lipid profile and other risk factors would entail lipid lowering medications, the test must be repeated with direct methods. Important treatment decisions should not be based on calculated values. Also direct methods will be essential in cases with TG >400mg/dl and diabetics who cannot endure long hours of fasting.
In the future, new methods may be implemented for determining LDL-C levels, such as one recently described, which is reagent-free and based on infrared spectrophotometric absorption of lipoproteins [12]. That method had excellent performance, and its assessment may shed light on the debate about the introduction of new methods for LDL-C measurement.
References
- Measurement of low density lipoprotein cholesterol In: Rifai N, Warnick GR, Dominiczak MH, eds. Handbook of Lipoprotein Testing (3rd ed). Washington DC: AACC Press; 1997. p. :145-60.
- [Google Scholar]
- Estimation of the concentration of low density lipoproteins cholesterol in plasma without use of the ultracentrifuge. Clin Chem. 1972;18:499-502.
- [Google Scholar]
- Calculated values of low-density lipoprotein in the assessment of lipid abnormalities and coronary disease risk. Clin Chem. 1990;36:36-42.
- [Google Scholar]
- Calculated low-density lipoprotein cholesterol should not be used form management of lipoprotein abnormalities in patients with diabetes mellitus. Diabetes Care. 1993;16:1081-6.
- [Google Scholar]
- Effect of serum lipoprotein (a) on estimation of low density lipoprotein cholesterol by Friedewald formula. Clin chem. 1994;40:571-3.
- [Google Scholar]
- Analytical and clinical performance of a detergent-based homogeneous LDL-cholesterol assay: a multicenter evaluation. Clin. Chem. 2000;46:506-14.
- [Google Scholar]
- Analytical and clinical evaluation of two homogeneous assays for LDL-cholesterol in hyperlipidemic patients. Clin. Chem. 2000;46:1121-31.
- [Google Scholar]
- Evaluation and clinical application of a direct low density lipoprotein cholesterol assay in normolipidemic and hyperli pidemic adults. Am. J. Cardiol. 1997;80:1295-9.
- [Google Scholar]
- Evaluation of commercial reagent for precipitating human serum low density lipoprotein. Clin Chem Acta. 1985;152:213-7.
- [Google Scholar]
- Arq Bras Cardiol. 2004;83(6):455-61.
- [Google Scholar]
- Reagent-free, simultaneous determination of serum cholesterol in HDL and LDL by infrared spectroscopy. Clin Chem. 2002;48:499-506.
- [Google Scholar]


