
Translate this page into:
Impact of 24 h of isolation and confinement exposure on psychological state of healthy human volunteers

-
Received: ,
Accepted: ,
How to cite this article: Mohapatra SS, Anand K, Raju AVK. Impact of 24 h of isolation and confinement exposure on psychological state of healthy human volunteers. Indian J Aerosp Med 2020;64(1):37-45.
Abstract
Introduction:
During space missions, crew is encountered with various psychological challenges. One major challenge during space mission is the issue of isolation and confinement. Understanding of human behavior and performance in isolated and confined environment (ICE) has been the area of interest for all those involved in human space program. Ground-based mission-specific studies are necessary before undertaking any specific mission so that the psychological impact of ICE can be investigated in details. The first human space flight of India, which may be launched in the near future, may involve for a duration not more than 24 h. This scientific experiment was undertaken with an aim to study the impact of 24 h isolation and confinement on psychological state of healthy human volunteers.
Material and Methods:
During 24 h period of isolation and confinement, 10 healthy human volunteers were evaluated every 10–12 h with State-Trait Anxiety Inventory, Positive and Negative Affect State (PANAS), and Profile of Mood States (POMS) in the existing Isolation cum Group Confinement laboratory of Institute of Aerospace Medicne (IAM). Similar psychological evaluation was also carried out among nine healthy individuals who served as controls.
Results:
There was a momentary increase in state anxiety level during early period of isolation and confinement exposure (ICE). However, the anxiety level returned to pre-exposure level after 24 h. Furthermore, there was a significant drop in the level of negative emotions among the subject group as well as among control group in the morning of day 2 though there was no significant change in the positive emotions. Over the period of 24 h of isolation and confinement, neither the subject group nor the control group showed statistically significant changes in the total mood disturbance. None of the groups showed any significant changes in any of the POMS subscales, that is, anger-hostility, confusion-bewilderment, depression-dejection, fatigue-inertia, and tension-anxiety except for vigor-activity. Thus, a stable mood state was observed among the participants.
Conclusion:
Before exposure to isolation and confinement, the subject group exhibited a higher level of “State” anxiety on day 1 which had returned to pre-exposure level in the morning of day 2. In both days, the state of positive emotions was statistically insignificant among subject as well as among control group. However, a significant decrease in the level of negative emotions among the subject group and control group was observed. There was no significant change in the mood state in the study group as well as in the control group.
Keywords
Isolation and confinement exposure
Mood
Emotion
Anxiety

INTRODUCTION
During space missions, crew is encountered with various psychological challenges. One major challenge during space mission is the issue of isolation and confinement. Understanding of human behavior and performance in isolated and confined environment (ICE) has been the area of interest for all those involved in human space program. Four groups of psychological symptoms are expected when an individual or a group of individuals is removed from a social environment and put into an isolated and confined environment. These are mental deficiencies, decline in motivation, somatic complaints, and change in mood and morale.[1] These psychological issues need to be identified and addressed so that the crew performance is not hampered and largely, the group dynamics is maintained during a multicrew space mission. Identification of adverse effects arising from isolation and confinement is an important step toward formulating the guidelines for the expert group while selecting the “Right Stuff” and subsequently, during the development of appropriate countermeasures for human space program.
Analogs and simulators have been developed to create an approximate environment of similar challenges that the crew would counter in actual space missions. ICEs, which include Antarctica expedition,[2,3] submarine mission,[4] ground-based spaceflight simulation, and others,[5-8] have been used to study human psychological issues encountered during space flight. Psychologically, isolation can affect any individual. The nature and severity of such impact depend on the individual, the duration, and particular conditions (e.g., access to natural light, books, or radio). Investigators have used space analog conditions and confirmed that the participants face various psychological problems such as anxiety, depression, anger, cognitive and perceptual disturbances, obsessive thoughts, and psychosis.[9] Similarly, some studies on confined prisoners had recorded adverse psychological changes, which include irritability, hostility, and poor impulse control. Isolated subjects also experience symptoms of depression such as hopelessness, mood swings, and withdrawal.[10,11] Ground-based mission-specific studies are necessary before undertaking any specific mission so that the psychological impact of ICE can be investigated in details.
The first human space flight of India, which may be launched in the near future, may involve for a duration not more than 24 h. It is very pertinent, therefore, to study the psychological changes which might affect an individual when isolated and confined for 24 h. Furthermore, it is understood that a crew following a splash down over sea may encounter a challenging environment being isolated completely for few hours to few days. Studies on the psychological impact of 24 h of isolated and confined environment are sparsely available in the literature. This scientific experiment was undertaken with an aim to study the impact of 24 h isolation and confinement on psychological state of healthy human volunteers.
MATERIAL AND METHODS
Subjects
Ten healthy male subjects in the age group of 20–45 years were selected for ICE study. Ten healthy males of a similar age group were included as control. The inclusion and exclusion criteria for the selected population were as follows:
Armed force personnel (male).
In good physical and mental health.
Medical category not lower than SHAPE 2 of army (equivalent category of Air Force and Navy).
Volunteering for the study.
The exclusion criteria included the disabilities such as depression, anxiety, brain injury, epilepsy, and other CNS problems or any history of and drug/substance abuse.
Intervention
The subjects in the experimental/subject group were isolated and confined for a period of 24 h in the Sleep cum Confinement laboratory at the Institute of Aerospace Medicine. The control group individuals were not isolated and confined. They continued their work as the experiment observers.
Sleep cum Confinement laboratory of IAM
The Sleep cum Confinement laboratory, developed at IAM for Human Space Programme, is sound-proof with the facilities to isolate one or more subjects (up to a maximum of six). The sound levels in the room have a differential attenuation of 50 dB from the external atmosphere. The entire laboratory including the subject’s room and observer’s room is suitably air-conditioned. The other essential facilities include a controlled/programmable lighting system, twoway communication system, and CCTV/audio monitoring. Amenities such as tread mill for exercise, bunk beds, TV, fridge, coffee making machine, and microwave oven are also provided in the subject room.[12]
Psychological Tests & Tools
Various psychological parameters before and after exposure to 24 h isolation and confinement on both the subject group and control group were determined and analyzed by employing appropriate statistical tools. The following psychological tests were used:
State and Trait Anxiety Inventory (STAI)
STAI (Spielberger, C.D. 1983) is a psychological inventory having 40 questions on a 4-point Likert scale.[13] The STAI measures two types of anxiety – state anxiety, or anxiety about an event, and trait anxiety, or anxiety level as a personal characteristic. Higher scores are positively correlated with higher levels of anxiety. It was developed by psychologists Spielberger et al. The STAI can be utilized across a wide range of socioeconomic statuses and only a sixth-grade reading level is required to understand the test. It is used in diagnoses, in both clinical and other medical settings, as well as in research.
Positive Affect and Negative Affect Schedule
It is a 10-item questionnaire which measures both positive and negative emotions (affect). Each item is rated on a 5-point scale of 1 (not at all) to 5 (very much). Positive and Negative Affect State (PANAS) can be used as a research tool, but can also be utilized in clinical and non-clinical settings.[14,15]
Profile of Mood States (POMS)
The subjective questionnaire called POMS was selected to measure psychological status of the participants. Various mood states can be identified by employing POMS. This scale was developed by McNair, Droppleman, and Lorr (1971).[16] The six different dimensions of mood swings which can be measured by the POMS are tension or anxiety (T), anger or hostility (A), vigor or activity (V), fatigue or inertia (F), depression or dejection (D), and confusion or bewilderment (C). A total mood disturbance (TMD) score is derived by summing the negative scores of five subscales (T, D, A, F, and C) and subtracting the unique positive score of V. There are two forms of the test; the long form that is administered primarily to adults and the short form which is primarily administered to adolescents. Advantages of using this assessment include the simplicity of administration and ease of participant understanding. Another feature of the assessment that is notable is psychological states can be assessed quickly due to the simplicity of the test. This instrument has been used in isolation and confinement studies.[17,18]
Study design
The study was a case–control study having following protocol:
Informed written consent was taken from all participants.
The study was carried out from 8 am to 8 am next day. One subject was kept inside the sleep cum confinement laboratory for isolation and confinement exposure. One individual from the control group remained in the observation room adjacent to the laboratory.
-
During isolation and confinement, the following were ensured for experimental group:
Usage of mobile phone, wrist watch, and any type of communications with outside environment were prohibited.
Standardized ready-to-cook food was kept inside the laboratory with an instruction sheet regarding its preparation and consumption.
The subjects were also permitted to perform their routine exercises using the tread mill which was available inside the laboratory.
-
During isolation and confinement, the following were ensured for control group:
There was no restriction on the use of mobile phone, wrist watch, or on communications with outside environment.
Consumption of standard meals prepared in the officer’s mess.
The controls were also permitted to perform their routine exercises.
Tests administration
Psychological testing (STAI, PANAS, and POMS) was carried out just before entering into the laboratory. Subsequently, these tests were repeated in the next day morning. These tests were also carried out on each control in the similar frequencies.
Statistical analysis
Microsoft Word and Excel was used for descriptive and inferential statistical analysis and also to generate graphs, tables, etc. Results on ordinal data were presented with median’s keeping the significance at 5 % level. To analyze the effects of 24 h ICE on psychological parameters, Mann– Whitney U-test (two tailed, independent) was used to find the variation of study parameters (medians) between two groups (between the groups analysis). Wilcoxon W-test (two tailed, dependent) was used to find the variation of study parameters (medians) within each group (within the group analysis) on day 2 from day 1.
RESULTS
A total of 10 subjects and 10 controls had volunteered for the study. However, one control could not complete the study protocol due to certain personal reasons. All these participants were male. The mean and SD for the age were 34 ±4 years for the subject group and 35.5 ± 3.5 years for the control group. All were married (except two in the subject group and one in the control group). All were from the Armed Forces Services and Doctors by profession.
Table 1 depicts the comparison of anxiety level based on STAI scores. Results of “between the group comparison” revealed that the trait anxiety scores were not significantly different between the subject group and control group on the morning of day 1 (median of 33 vs. 32; Mann–Whitney U-test value of 30 > critical value of 12, indicating statistically non-significant difference). However, state anxiety score in the morning of day 1 was significantly higher among the subjects (median of 35 vs. 26; Mann–Whitney U-test values of 11.5 < critical value of 12, indicating statistically significant difference). On the morning of day 2, the same was not significantly different (median of 26 vs. 28; Mann–Whitney U-test values of 30.5 > critical value of 12, indicating statistically non-significant difference) among the subject group and control group. The results of “within the group variation” showed that there was a significant decrease in state anxiety score from its day 1 morning score to day 2 morning score among subjects (median of 35 vs. 26; Wilcoxon W-test values of 1 < critical value of 5, indicating statistically significant difference). However, similar trend was not observed in the control group (median of 26 vs. 28; Wilcoxon W-test values of 8 > critical value of 0, indicating statistically non-significant difference).
| Variables | Between the group comparison by Mann–Whitney U-test | |||||
|---|---|---|---|---|---|---|
| Study group | Control group | U value | Critical value | S/NS at P</> 0.05 | ||
| Trait anxiety in morning of day 1 | 33 | 32 | 30 | 12 | NS (as U>C) | |
| State anxiety in morning of day 1 | 35 | 26 | 1.5 | 12 | S (as U<C) | |
| State anxiety in morning of day 2 | 26 | 28 | 30.5 | 12 | NS (as U>C) | |
| Within the group comparison by Wilcoxon test | W value | 1 | 8 | - | - | - |
| Critical value | 5 | 0 | - | - | - | |
| S/NS at P</> 0.05 S/NS at P</> 0.05 | S (as W<C) | NS (as W>C) | - | - | - | |
Table 2a depicts the level of positive emotions based on PANAS scores. Results of “between the group comparison” show that the scores for positive emotions were not significantly different between the subject group and control group either on the morning of day 1 (median of 34 vs. 37.5; Mann–Whitney U-test values of 19.5 > critical value of 15, indicating statistically non-significant difference) or day 2 (median of 36 vs. 41; Mann–Whitney U-test values of 21 > critical value of 15, indicating statistically non-significant difference). Similarly, the results of “within the group variation” showed that the day 1 morning score is not different from the day 2 morning score for positive emotions in PANAS neither in the subject group (median of 34 vs. 36; Wilcoxon W-test values of 20 > critical value of 5, indicating statistically non-significant difference) nor in the control group (median of 37.5 vs. 41; Wilcoxon W-test values of 10 > critical value of 0, indicating statistically non-significant difference).
| Variables | Between the group comparison by Mann–Whitney U-test | |||||
|---|---|---|---|---|---|---|
| Study group | Control group | U value | Critical value | S/NS at P</> 0.05 | ||
| Positive emotions in morning of day 1 | 34 | 37.5 | 19.5 | 15 | NS (as U>C) | |
| Positive emotions in morning of day 2 | 36 | 41 | 21 | 15 | NS (as U>C) | |
| Within the group comparison by Wilcoxon test | W value | 20 | 10 | - | - | - |
| Critical value | 5 | 0 | - | - | - | |
| S/NS at P</> 0.05 | NS (as W>C) | NS (as W>C) | - | - | - | |
Table 2b depicts the level of negative emotions based on PANAS score. Results of “between the group comparison” revealed that the scores for negative emotions were not significantly different between the subject group and control group on morning of day 1 (median of 12 vs. 10.5; Mann– Whitney U-test values of 35.5 > critical value of 15, indicating statistically non-significant difference) or in the morning of day 2 (median of 10 vs. 9.5; Mann–Whitney U-test values of 34 > critical value of 15, indicating statistically non-significant difference). However, the results of “within the group variation” showed a significantly lower level of day 2 morning score in comparison to the day 1 morning score for negative emotions for the subject group (median of 12 vs. 10; Wilcoxon W-test values of 1.5 < critical value of 2, indicating statistically significant difference) as well as for the control group (median of 10.5 vs. 9.5; Wilcoxon W-test values of 0 < critical value of 3, indicating statistically significant difference).
| Variables | Between the group comparison by Mann–Whitney U-test | |||||
|---|---|---|---|---|---|---|
| Study group | Control group | U value | Critical value | S/NS at P</> 0.05 | ||
| Negative emotions in morning of day 1 | 12 | 10.5 | 35.5 | 15 | NS (as U>C) | |
| Negative emotions in morning of day 2 | 10 | 9.5 | 34 | 15 | NS (as U>C) | |
| Within the group comparison by Wilcoxon test | W value | 1.5 | 0 | - | - | - |
| Critical value | 2 | 3 | - | - | - | |
| S/NS at P</> 0.05 | S (as W<C) | S (as W<C) | - | - | - | |
In POMS, results [Table 3a and b] indicate that the variables for TMD or any of its subscales are not different in “between the group comparison.” While carrying out “within the group comparison,” there was no significant variation in the TMD scores of morning of day 1 and morning of day 2 both among the subject group (median of −19.5 vs. −13.5; Wilcoxon W-test values of 13 > critical value of 3, indicating statistically non-significant difference) as well as among the control group (median of −19.5 vs. −13.5; Wilcoxon W-test values of 13 > critical value of 3, indicating statistically non-significant difference). Similarly, while carrying out “within the group comparison” between the morning POMS score of day 1 with the morning POMS score of day 2, there were no significant variations in any of the POMS subscales except for the subscale “Vigor-activity” among the subject group which revealed a statistically significant decrease (median of 17 vs. 16; Wilcoxon W-test values of 2 < critical value of 5, indicating statistically significant difference).
| Subscales of POMS | Between the group comparison by Mann–Whitney U-test | |||||
|---|---|---|---|---|---|---|
| Study group | Control group | U value | Critical value | S/NS at P</> 0.05 | ||
| Anger/hostility | ||||||
| Morning of day 1 | 1 | 0.5 | 32 | 15 | NS (as U>C) | |
| Morning of day 2 | 1 | 0.5 | 31.5 | 15 | NS (as U>C) | |
| Within the group comparison by Wilcoxon test | W value | 12 | 12 | - | - | - |
| Critical value | 2 | 2 | - | - | - | |
| S/NS at p</> 0.05 | NS (as W>C) | NS (as W>C) | - | - | - | |
| Confusion/bewilderment | ||||||
| Morning of day1 | 2 | 1 | 18 | 15 | NS (as U>C) | |
| Morning of day 2 | 2 | 1 | 24 | 15 | NS (as U>C) | |
| Within the group comparison by Wilcoxon test | W value | 18.5 | 18 | - | - | - |
| Critical value | 5 | 3 | - | - | - | |
| S/NS at P</> 0.05 | NS (as W>C) | NS (as W>C) | - | - | - | |
| Depression/dejection | ||||||
| Morning of day 1 | 0 | 1 | 32.5 | 15 | NS (as U>C) | |
| Morning of day 2 | 1 | 1.5 | 30.5 | 15 | NS (as U>C) | |
| Within the group comparison by Wilcoxon test | W value | 16 | 7 | - | - | - |
| Critical value | 5 | 3 | - | - | - | |
| S/NS at P</> 0.05 | NS (as W>C) | NS (as W>C) | - | - | - | |
| Fatigue/inertia | ||||||
| Morning of day 1 | 0 | 0 | 36 | 15 | NS (as U>C) | |
| Morning of day 2 | 1 | 2 | 30 | 15 | NS (as U>C) | |
| Within the group comparison by Wilcoxon test | W value | 20 | 8 | - | - | - |
| Critical value | 5 | 2 | - | - | - | |
| S/NS at P</> 0.05 | NS (as W>C) | NS (as W>C) | - | - | - | |
| Tension/anxiety | ||||||
| Morning of day 1 | 3 | 2.5 | 26.5 | 15 | NS (as U>C) | |
| Morning of day 2 | 2 | 3 | 29 | 15 | NS (as U>C) | |
| Within the group comparison by Wilcoxon test | W value | 7.5 | 14 | - | - | - |
| Critical value | 0 | 3 | - | - | - | |
| S/NS at P` </> 0.05 | NS (as W>C) | NS (as W>C) | - | - | - | |
| Vigor/activity | ||||||
| Morning of day 1 | 17 | 22.5 | 30 | 15 | NS (as U>C) | |
| Morning of day 2 | 16 | 20 | 31 | 15 | NS (as U>C) | |
| Within the group comparison by Wilcoxon test | W value | 2 | 11 | - | - | - |
| Critical value | 5 | 3 | - | - | - | |
| S/NS at P</> 0.05 | S (as W<C) | NS (as W>C) | - | - | - | |
| POMS | Between the group comparison by Mann–Whitney U-test | |||||
|---|---|---|---|---|---|---|
| Total mood disturbance (TMD) | Study group | Control group | U value | Critical value | S/NS at P</> 0.05 | |
| Morning of day 1 | −10 | −19.5 | 24.5 | 15 | NS (as U>C) | |
| Morning of day 2 | −8 | −13.5 | 28.5 | 15 | NS (as U>C) | |
| Within the group comparison by Wilcoxon test | 13 | 13 | 14 | - | - | - |
| 3 | 3 | 3 | - | - | - | |
| S/NS at P</> 0.05 | NS (as W>C) | NS (as W>C) | - | - | - | |
DISCUSSION
The ICE is an area of environmental stress which has gained a large place in all human space flight programs. The behavioral changes which are associated with ICEs include anxiety, low motivation, mood swing, emotional imbalance, social withdrawal, depressions, hostility toward others, decreased alertness, and mental functioning, increase in somatic complaints such as sleep disturbances, poor appetite, and indigestion. Ground-based studies to understand the psychological impacts of ICE are important steps towards formulating procedures and policies involving crew selection and training of space crew. Earthbound analogs to extrapolate the ICE condition of space flight are limited. Therefore, space simulators have been developed and used worldwide. Canadian Astronaut Program Space Unit Life Simulation, NASA Extreme Environment Mission Operations, Mars Research Desert Station, Isolation Study for the European Manned Space Infrastructure, Experimental Campaign for the European Manned Space Infrastructure, Human Behavior in Extended Spaceflight, Flashline Mars Arctic Research Station, Simulation for Flight of International Crew on Space Station, Human Exploration Research Analog, and Hawaii Space Exploration Analog and Simulation were such simulators, which had been developed to undertake mission-specific experimental studies with a duration varying from 7 to 700 plus days.[19] However, for a space mission lasting not more than 24 h which could be the case for first Indian Space Mission, a dedicated short duration ICE study was envisaged.
Institute of Aerospace Medicine at Bengaluru (India) is the nodal agency for the consultation on all matters pertaining to health and performance of aircrew and space crew. Laboratory offering group isolation and confinement was an initiative to develop the ICE facilities to be utilized as a part of psychological mission support for Indian Human Space Program. This study was undertaken as a pilot project with an aim to determine the psychological impacts of 24 h isolation and confinement on healthy individuals.
During 24 h period of isolation and confinement, 10 healthy human volunteers were evaluated with State-Trait Anxiety Inventory (STAI), Positive and NA State (PANAS), and POMS in the existing isolation cum group confinement laboratory of IAM. Similar psychological evaluations were also carried out among nine healthy individuals who served as controls.
Results [Table 1 and Figure 1a] of “between the group comparison” showed that the trait anxiety score of the subject group was not significantly different from the control group suggesting both groups are “constitutionally” similar.

- Change in psychological parameters among the study group and control group during 24 h isolation and confinement period.
However, the state anxiety score in the morning of day 1 was significantly higher among the subjects. This could be due to the apprehension and anxiety before exposure to ICE. It was also observed that state anxiety level was not significantly different between the subject group and the control group in the morning of day 2. This could be due to the decrease in anxiety level of the study group, which was evident in the results of “within the group variation.” There was a significant decrease in state anxiety score from its day 1 morning score to day 2 morning score among subjects. It could be possible that the participants had adopted the stress coping skills adequately to decrease their anxiety. No such changes were observed in the control group.
For positive emotions, the results [Table 2a and Figure 1b] of “between the group comparison” showed indifferent levels of positive affect scores among the study group and the control group. The PA scores in the morning of day 2 for both the groups were also similar and there was no significant difference. The results were also indicative of absence of any “within the group variation” between the day 1 morning score and day 2 morning score for positive emotions among the subject group as well as among the control group. This suggests that isolated and confined group could maintain the positive emotions in a manner similar to the control group during 24 h period of ICE.
Negative emotions [Table 2b and Figure 1c] of the isolated and confined group were not significantly different from the control group at any time of the ICE, that is, morning of day 1 or in the morning of day 2. Rather, when NA scores of the morning of day 2 were compared with that of morning of day 1, there was statistically significant lowering of negative emotions both among the subject group and among the control group.
The Positive and NA Schedule (PANAS) is a widely used measure of positive affect and NA. Positive affect (PA) is defined as the extent to which a person feels pleasantly alert. High levels of positive affect indicate a state of positive engagement and low levels of positive affect indicate a state of sadness and lethargy.[15] PA scores can range from 10 to 50, with higher scores representing higher levels of positive affect. The mean scores for PA are 33.3 (SD ± 7.2).[15] The subject and control groups have higher PA both in the morning of day 1 (34 and 37.5, respectively) and day 2 (36 and 41, respectively) and there were no statistically significant changes in these levels for after 24 h of ICE.
NA is defined as a dimension of subjective distress, which encompasses states such as hostility, irritability, being ashamed, guilty, upset and distressed, afraid/scared, jittery, and nervousness. Overall, high levels of NA are defined as a state of significant distress, while low levels of NA are defined as a state of calmness. NA scores can range from 10 to 50, with lower scores representing lower levels of NA. The mean score for NA was 17.4 (SD ± 6.2).[15] The subject and control groups had lower NA both in the morning of day 1 (12 and 10.5, respectively) and day 2 (10 and 9.5, respectively). It was interesting to note that in both the groups, there was significant decrease in NA on day 2 in comparison to day 1. However, a web search in this regard could not find any relevant studies to ascertain this phenomenon. Similar studies involving a larger sample size may be required to establish this fact.
In profile mood state (POMS), results [Table 3 and Figure 1d] indicated that the variables for TMD or any of its subscales (anger-hostility, confusion-bewilderment, depression-dejection, fatigue-inertia, and tension-anxiety) were not different in “between the group comparison.” Similarly, in the “within the group variation,” when morning POMS score of day 1 was compared with the morning POMS score of day 2, there was no significant variation in the subject group nor in the control group except for the subscale “Vigor-activity” for the subject group. Vigor-activity subscale in the morning of day 2 was significantly lower in comparison to the morning of day 1 among the subject group. In spite of decrease in vigor, the TMD remained unchanged among the isolated and confined group. This suggests that the isolation and confinement for a duration of 24 h is not high enough to bring any mood disturbances.
Morgan and Johnson (1978) found that by plotting the mood state scores of elite performers prior to a challenging event, a typical graph exhibited [Figure 2]. This graph, with a raised peak for vigor, was termed the “Iceberg” profile.[20] The iceberg type curve is the feature of stable state of mood which is found among successful elite performers.
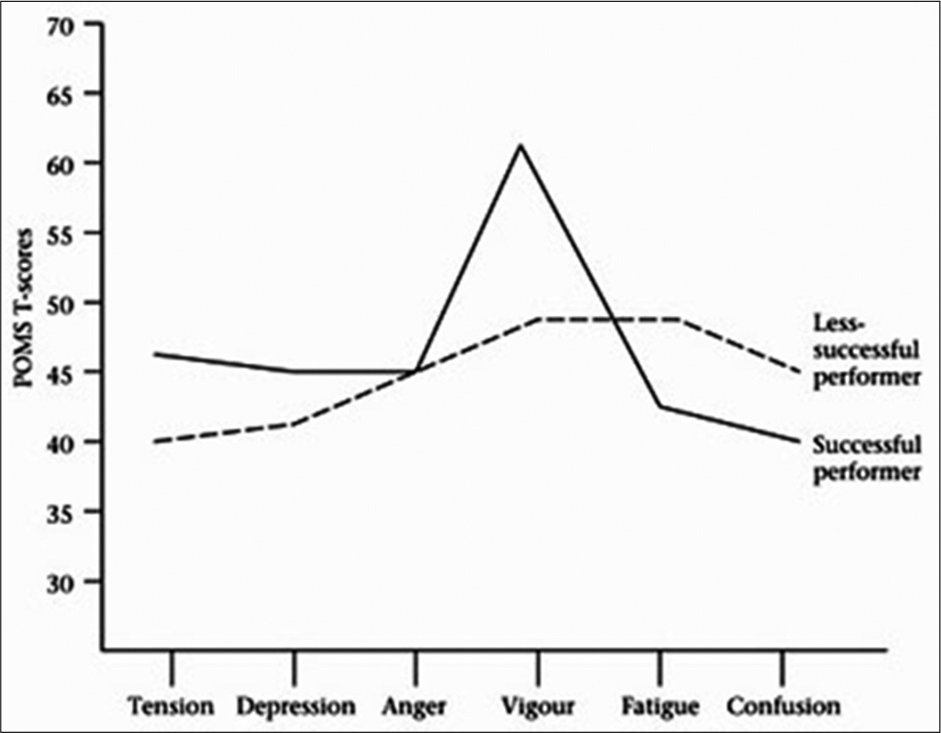
- Plotting of mood state exhibiting “iceberg” phenomenon.
This feature was also observed in this study among the subject group as well as among the control group in both occasions, in the mornings of day 1 and day 2 indicating stability of mood state [Figure 3].
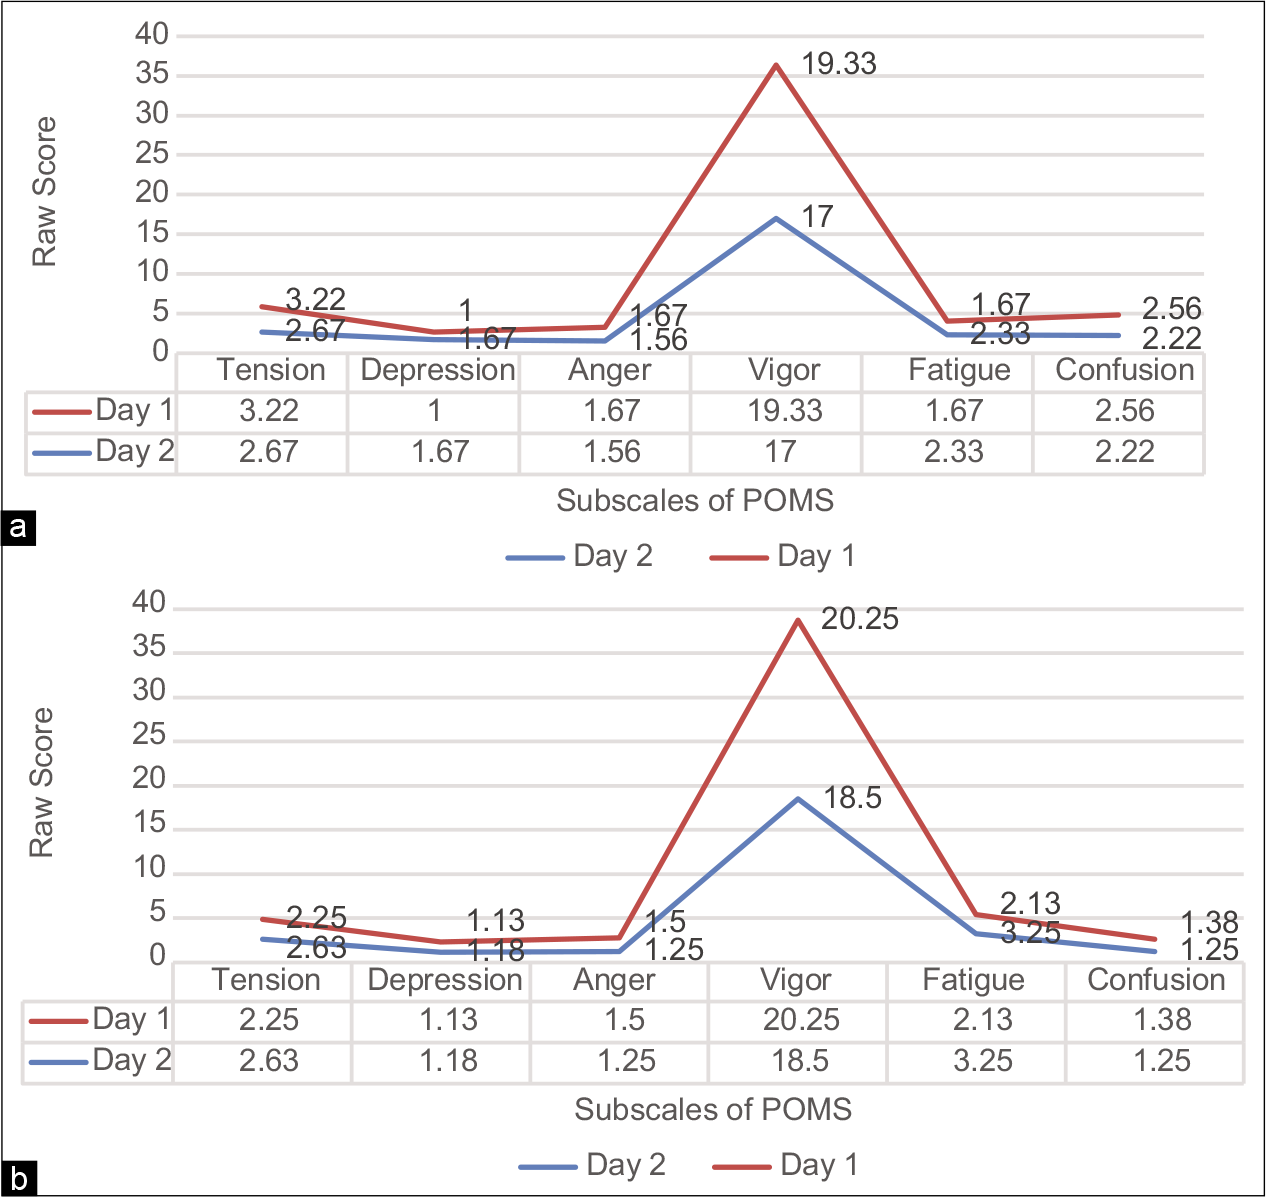
- Plotting of mood state of the study group and control group exhibiting “iceberg” phenomenon.
CONCLUSION
It is reasonable to conclude that before the exposure to ICE, there was a momentary increase in anxiety level among the study group, which had returned to pre-exposure level in the next day morning (after 24 h). Similarly, both the groups had indifferent level of positive and negative emotions in the morning of day 1. After a period of 24 h, no statistically significant changes in the positive emotions were observed in the study group as well as in the control group. Interestingly, there was a statistically significant lowering of negative emotions both in the subject and control groups. It was also observed that both the study and the control group did not show any changes either in the TMD or in any of the POMS subscales (anger, confusion, depression, fatigue, and tension) except for the vigor subscale. Despite the decrease in vigor, the mood state in both subjects remained stable during the period of isolation and confinement.
Declaration of patient consent
The authors certify that they have obtained all appropriate consent from the participants.
Financial support and sponsorship
Nil.
Conflicts of interest
There are no conflicts of interest.
References
- Psycho-social issues of space flight In: Fundamentals of Space Medicine (2nd ed). El Segundo, California, USA: Microcosm Press, Springer; 2005. p. :205-6.
- [Google Scholar]
- Stages of change in mood and behavior during a winter in Antarctica. Environ Behav. 2000;32:128-41.
- [CrossRef] [PubMed] [Google Scholar]
- Relationships between mood states and performances in reaction time, psychomotor ability, and mental efficiency during a 31-day gradual decompression in a hypobaric chamber from sea level to 8848 m equivalent altitude. Physiol Behav. 2000;71:469-76.
- [CrossRef] [Google Scholar]
- The influence of exercise on prefrontal cortex activity and cognitive performance during a simulated space flight to Mars (MARS500) Behav Brain Res. 2013;236:1-7.
- [CrossRef] [PubMed] [Google Scholar]
- Mars 520-d mission simulation reveals protracted crew hypokinesis and alterations of sleep duration and timing. Proc Natl Acad Sci. 2013;110:2635-40.
- [CrossRef] [PubMed] [Google Scholar]
- Progressive adaptation in physical activity and neuromuscular performance during 520d confinement. PLoS One. 2013;8:e60090.
- [CrossRef] [PubMed] [Google Scholar]
- Psychosocial Characteristics of Optimum Performance in Isolated and Confined Environments. 2011. Available from: http://www.ston.jsc.nasa.gov/collections/TRS [Last accessed on 2018 Sep 12]
- [Google Scholar]
- The effects of solitary confinement on prison inmates: A brief history and review of the literature. Crim Justice. 2006;34:441-568.
- [CrossRef] [Google Scholar]
- The effects of solitary confinement on prison inmates: A brief history and review of the literature. Crime Justice. 2006;34:441-528.
- [CrossRef] [Google Scholar]
- Mental health issues in long-term solitary and supermax confinement. Crime Delinq. 2003;49:123-56.
- [CrossRef] [Google Scholar]
- Manual for the State-Trait Anxiety Inventory Palo Alto, CA: Consulting Psychologists Press; 1983.
- [Google Scholar]
- The positive and negative affect schedule (PANAS): Construct validity, measurement properties and normative data in a large non-clinical sample. Br J Clin Psychol. 2004;43:245-65.
- [CrossRef] [PubMed] [Google Scholar]
- Development and validation of brief measures of positive and negative affect: The PANAS scales. J Pers Soc Psychol. 1988;54:1063-70.
- [CrossRef] [PubMed] [Google Scholar]
- During the long way to mars: Effects of 520 days of confinement (Mars500) on the assessment of affective stimuli and stage alteration in mood and plasma hormone levels. PLoS One. 2014;9:e87087.
- [CrossRef] [PubMed] [Google Scholar]
- Effect of the Antarctic environment on hormone levels and mood of Chinese expeditioners. Int J Circumpolar Health. 2003;62:255-67.
- [CrossRef] [PubMed] [Google Scholar]
- Psychological and Sociological Aspects of Manned Space Flight. In: Harrison AA, Clearwater YA, McKay CP, eds. From Antarctica to Outer Space: Life in Isolation and Confinement (1st ed). New York, USA: Springer-Verlag; 1991. p. :81-8.
- [Google Scholar]
- Personality characteristics of successful and unsuccessful oarsmen. Int J Sport Psychol. 1978;9:119-33.
- [Google Scholar]


