Translate this page into:
Cardiovascular dynamics among differently trained individuals during simulated microgravity exposure in the form of head-down tilt

*Corresponding author: Dr S Mandal, MBBS, Resident in Aerospace Medicine, Institute of Aerospace Medicine IAF, Vimanapura, Bengaluru - 560 017, Karnataka, India. drsoumen83@gmail.com
-
Received: ,
Accepted: ,
How to cite this article: Mandal S, Pipraiya R, Sinha B. Cardiovascular dynamics among differently trained individuals during simulated microgravity exposure in the form of head-down tilt. Indian J Aerosp Med 2020;64(2):76-81.
Abstract
Introduction:
Human morphology and physiology are not designed inherently to function in microgravity. Hence, exposure to hypo or microgravity, as it occurs during space exploration, poses challenges in the form of peculiar adaptive physiological processes in healthy astronauts. These changes may vary (to a certain extent) depending on type of physical fitness (namely, aerobic or anaerobic) and may have definitive impact on short duration space mission. The study aimed to examine the cardiovascular dynamics during short duration exposure to simulated microgravity condition in differently trained individuals.
Material and Methods:
Temporal variations in body fluid distribution were studied during 6° head-down tilt (HDT) for 4-hours in 31 healthy males in age range of 20–40 years divided into three groups based on their physical training, namely; resistance trained (RT), endurance trained (ET), and untrained (UT). This was based on their history of physical training, VO2 max, and peak anaerobic power.
Results:
Heart rate in the ET group and RT group showed increasing and decreasing trend respectively, however, statistically remained non-significant. Systolic and diastolic pressures showed a significant increase in the ET group at the 4th h of HDT as compared to baseline and the 1st h. No significant variation in pulse pressure could be seen. Mean arterial pressures showed significant increase in the ET group at the 4th h of HDT as compared to baseline and the 1st h of HDT. Stroke volume and cardiac output did not vary significantly.
Conclusion:
ET individuals in the present study demonstrated decreased sensitivity of baroreceptors than RT or UT individuals, whereas, the RT group demonstrated more stability/resilience in terms of cardiovascular dynamics than ET and UT groups under exposure to short duration simulated microgravity.
Keywords
Microgravity
Resistance training
Endurance training
Head-down tilt
INTRODUCTION
The earliest cardiovascular change of interest that gets manifested during acute exposure to microgravity (μg) is cephalad shift of body fluids due to the absence of earth’s gravitational effect which pulls the blood in the legs during upright (1G) position.[1,2] The major health concerns for the astronauts related to the effect of weightlessness are cardiovascular deconditioning, and upon returning to earth, orthostatic intolerance and reduced exercise capacity.[3] Many techniques such as endurance/aerobic exercises, resistive/anaerobic exercises, lower body negative pressure suit (e.g., Penguin/Chibis suits), human powered centrifuge, “Space Cycle,” and “Twin Bike” have been proposed so far to counter the effects of cardiovascular deconditioning.[4]
Individuals with different training patterns adapt in different manner to cardiovascular deconditioning. This variation may impart its effect during exposure to microgravity conditions. Hence, determination of optimal level of aerobic and anaerobic fitness in astronauts is of considerable significance. The present study was thus conducted to analyze the variation in cardiovascular dynamics among differently trained individuals on exposure to simulated microgravity using head-down tilt (HDT) which has been established as an acceptable method of microgravity simulation on ground and studying the physiological changes.[1,5,6]
MATERIAL AND METHODS
Subjects
Thirty-one healthy male volunteers between the age of 20 and 40 years participated in the study. The participants were selected based on their physical fitness/training. The participants were either service personnel (both non-combatants and combatants, e.g., ground training instructors) or local gymnasium instructors. They were examined clinically to rule out presence of any musculoskeletal, cardiovascular, respiratory, or vestibular diseases. Participants with h/o any infection or illness in preceding 1 week were also excluded from the study. They were explained about the protocol of the study and possible consequences of HDT. An informed written consent was obtained from each participant.
Classification of subjects
The participants were classified into three groups, namely; untrained (UT), endurance trained (ET), and resistance trained (RT). Physical fitness status of individuals was ascertained by self-declaration and by a protocol (“VO2 max” for Aerobic Capacity and “Vertical Jump Test” for “Peak Anaerobic Power”) designed at the Department of Space and Environmental Physiology, Institute of Aerospace Medicine, Indian Air Force.
Predictive value of VO2 max was estimated from the following equation:[7-9]
VO2 max (ml/kg/min) = 67.350–(0.381 × age in years)– (0.754 × BMI)+(1.951 × PA-R)
Peak anaerobic power was calculated from the following equation:[10-12]
Peak anaerobic power (watts) = (60.7 × vertical jump in cm)+(45.3 × body wt in kg)–2055.
Experimental design and protocol
The study involved repeated measure “between” and “within” the subject experimental design. The experimental protocol commenced at 0800 h on the nominated day of the study after light breakfast. Physiological effects of microgravity were simulated by the participant lying supine on the automated electrically operated multipurpose tilt table at 6° head-down for a period of 4 h.[13] Impedance cardiography by Cardioscreen® 1000 was used to measure heart rate (HR), stroke volume (SV), and cardiac output (CO). Blood pressure (systolic/ diastolic/mean arterial pressure [MAP]) was measured using DINAMAP™ ProCare Monitor during rest (i.e., supine) at the end of 1st, 2nd, 3rd, and 4th h of HDT. The study protocol was approved by the Institute Ethics Committee.
Statistical analysis
The data were analyzed by Statistica® 8.0. Normality was checked by Shapiro–Wilks “W” statistic. One-way between-within subjects repeated measure ANOVA was employed to analyze the data. On the significant outcomes obtained from ANOVA, Tukey’s HSD test was carried out for individual comparison. The level of significance was set at P < 0.05.
RESULTS
The physical characteristics of the participants are presented in Table 1. Table 2 depicts the aerobic and anaerobic capacity of the participants.
| Physical attributes | Training status | F-value | P-value | ||
|---|---|---|---|---|---|
| UT (n=10) | ET (n=11) | RT (n=10) | |||
| Age (year) | 29.4±5.10 | 26.7±4.84 | 28.8±4.05 | 0.961 | 0.395 |
| Height (cm) | 167.5±5.95 | 172.0±7.89 | 173.7±8.42 | 1.900 | 0.168 |
| Weight (kg) | 71.1±6.74 | 71.9±9.79 | 73.2±10.54 | 0.138 | 0.872 |
| BMI (kg/m2) | 25.3±1.39 | 24.2±1.63 | 24.1±1.67 | 1.705 | 0.200 |
UT: Untrained; ET: Endurance trained; RT: Resistance trained
| Physical attributes | Training status | F-value | P-value | ||
|---|---|---|---|---|---|
| UT (n=10) | ET (n=11) | RT (n=10) | |||
| VO2max | 38.5±2.09 | 52.0***±2.71 | 47.3***±1.96 | 95.027 | 0.000 |
| Peak anaerobic power (watts) | 2937.7±407.63 | 3383.3*±394.08 | 4204.9***±227.37 | 32.993 | 0.000 |
The HR response to head-down tilting in the three differently trained physical fitness groups is shown in Figure 1. The systolic blood pressure (SBP) and diastolic blood pressure (DBP) changes in the three groups following HDT are presented in Figures 2 and 3, respectively.
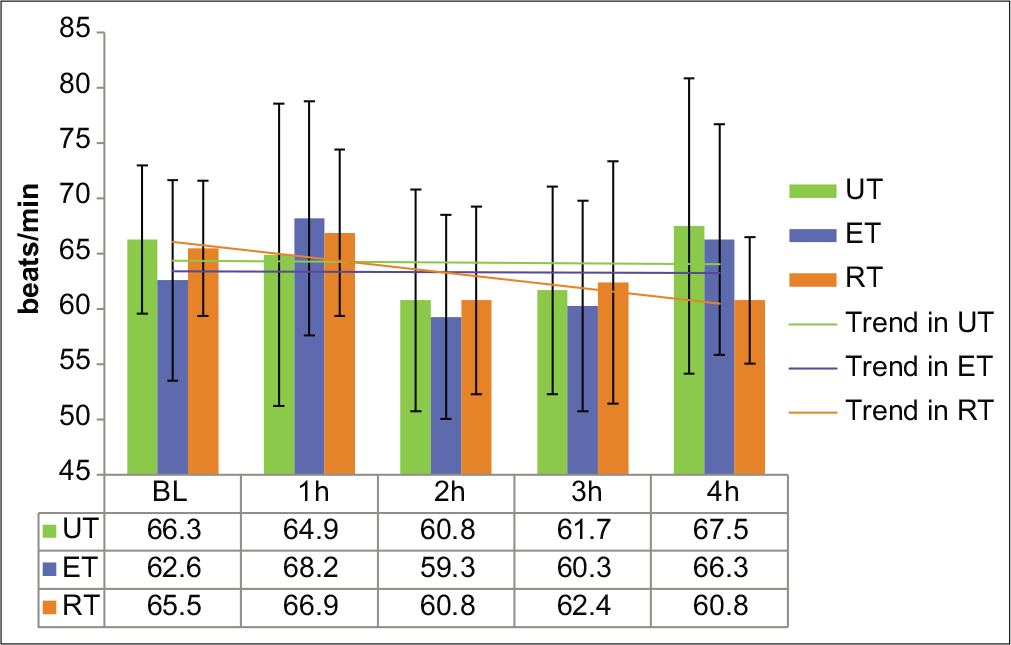
- Heart rate in the UT, ET, and RT groups at baseline and during 4 h of HDT. Values are expressed in beats/min as mean±SD. UT: Untrained; ET: Endurance trained; RT: Resistance trained.
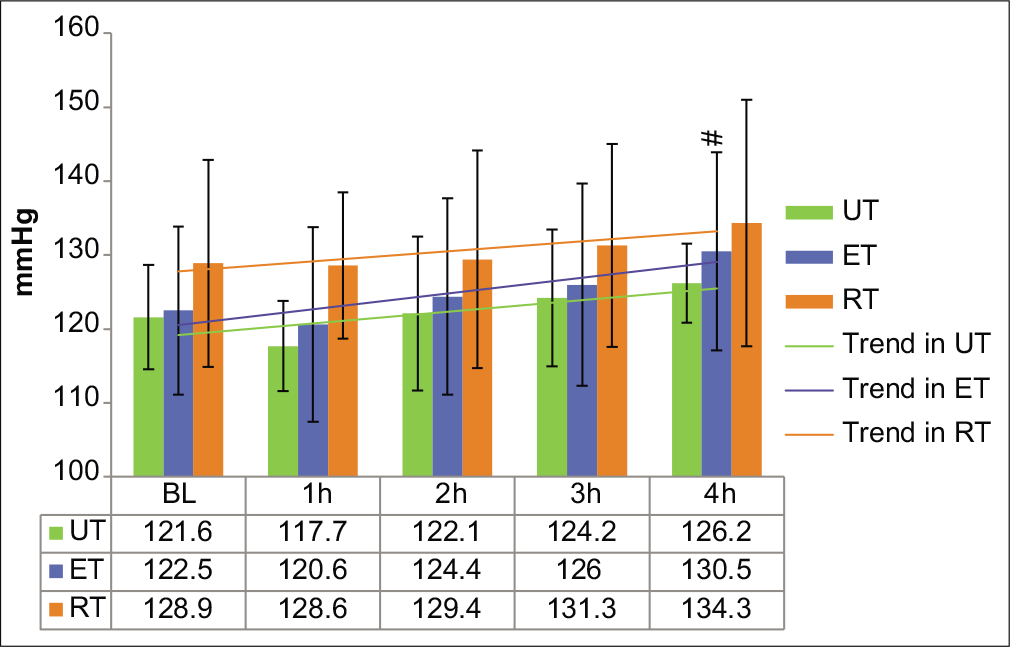
- Systolic blood pressure in the UT, ET, and RT groups at baseline and during 4 h of HDT. Values are expressed in mmHg as mean±SD. UT: Untrained; ET: Endurance trained; RT: Resistance trained. #P<0.05 from the 1st h.
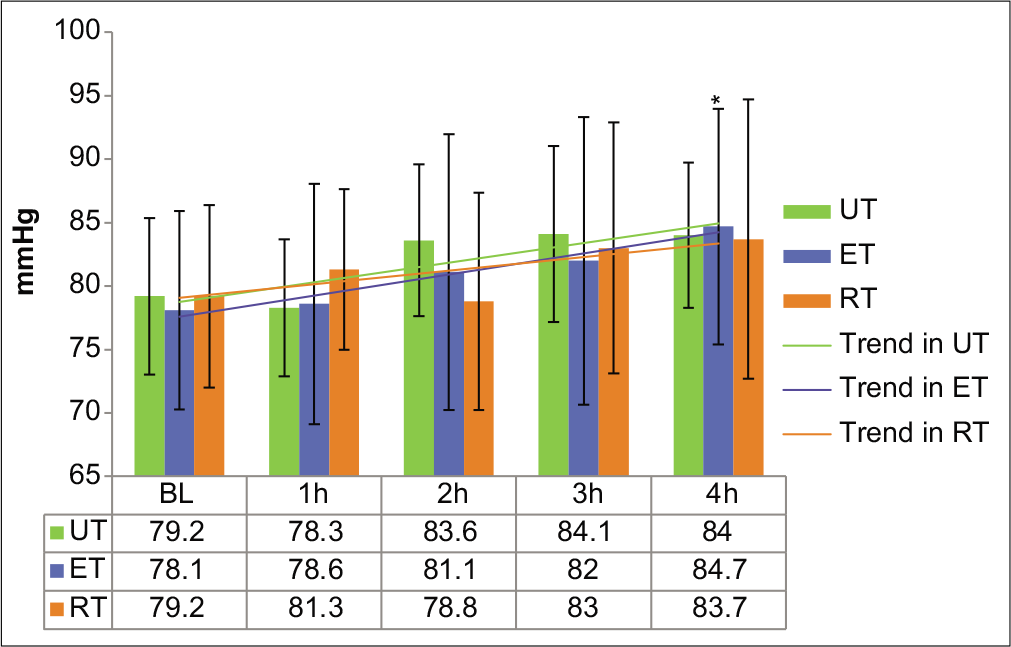
- Diastolic blood pressure in the UT, ET, and RT groups at baseline and during 4 h of HDT. Values are expressed in mmHg as mean±SD. UT: Untrained; ET: Endurance trained; RT: Resistance trained. *P<0.05 from baseline.
Figures 4 and 5 show the changes in the pulse pressure (PP) and MAP following HDT in the three physical fitness groups.
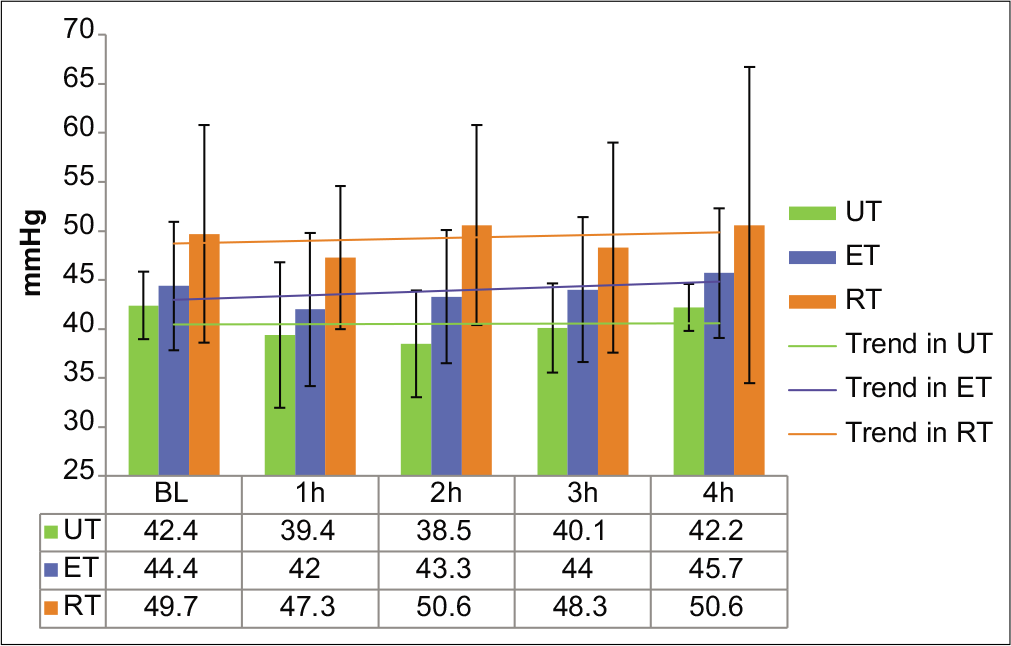
- Pulse pressure (PP) in the UT, ET, and RT groups at baseline and during 4 h of HDT. Values are expressed in mmHg as mean±SD. UT: Untrained; ET: Endurance trained; RT: Resistance trained.
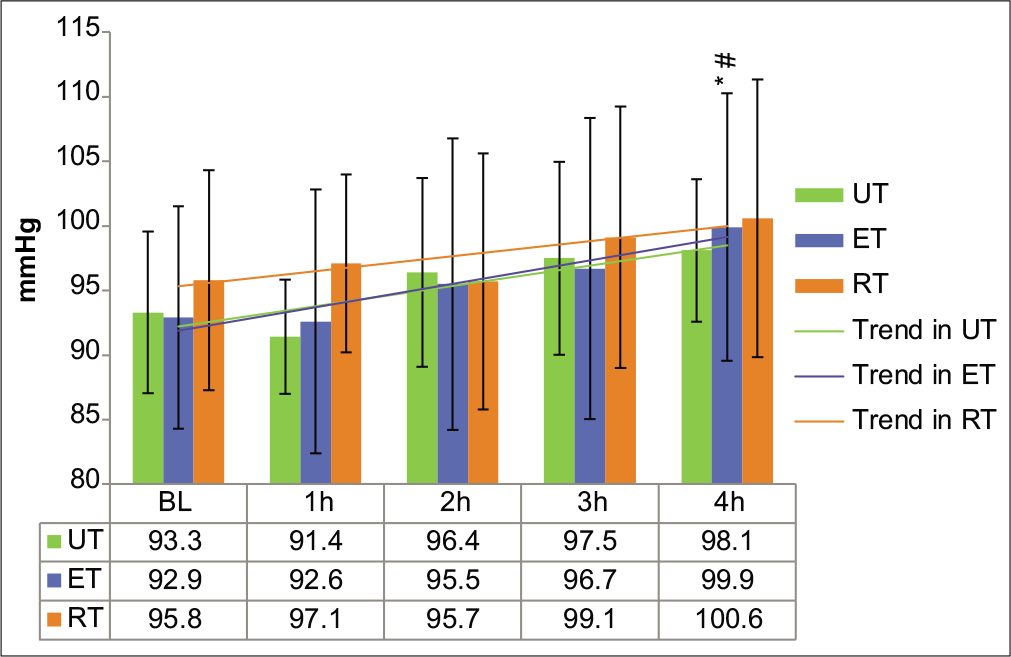
- Mean arterial pressure in the UT, ET, and RT groups at baseline and during 4 h of HDT. Values are expressed in mmHg as mean±SD. UT: Untrained; ET: Endurance trained; RT: Resistance trained. */#P<0.05, respectively, from baseline/1st h.
The SV and CO response to HDT in the three different fitness groups are presented in Figures 6 and 7.
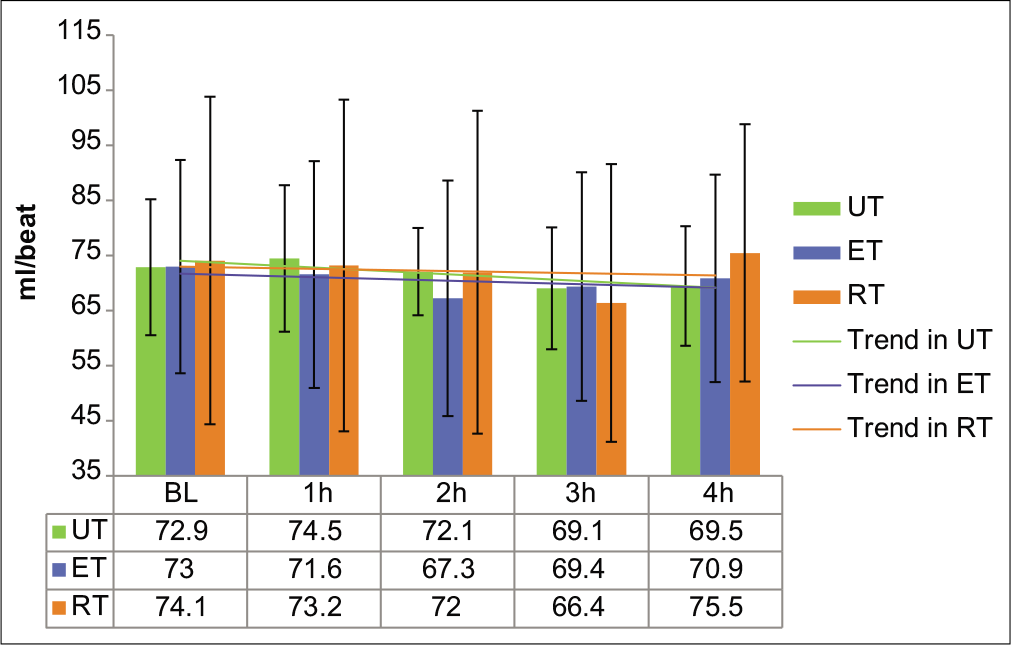
- Stroke volume in the UT, ET, and RT groups at baseline and during 4 h of HDT. Values are expressed in ml/beat as mean±SD. UT: Untrained; ET: Endurance trained; RT: Resistance trained.
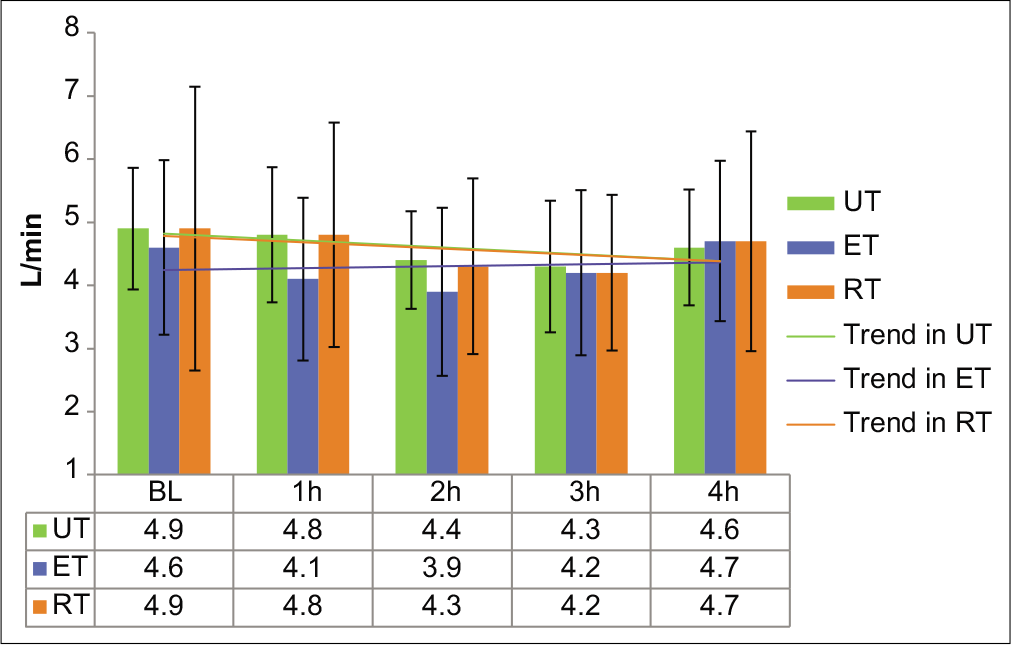
- Cardiac output in the UT, ET, and RT groups at baseline and during 4 h of HDT. Values are expressed in L/min as mean±SD. UT: Untrained; ET: Endurance trained; RT: Resistance trained.
DISCUSSION
Physical exercise training status is an integral part of astronaut selection procedures since beginning of human space missions. Level of physical fitness, by different training modalities, causes different types of physical changes in the body. For example, endurance training may result in plasma volume expansion and remodeling of heart musculature[14-17] with potential effect on physiological conditioning on exposure to microgravity conditions. This aspect is more relevant in short duration space missions wherein, time is a crucial factor, and hence, suboptimal operational capability of astronauts may compromise the objective of the mission.
Endurance or aerobic training promotes development of slow (oxidative) fibers or Type I muscle fibers. In marathon runners, these developments happen in the soleus muscle of the calf.[17] Resistance or anaerobic training promotes development of fast (glycolytic) fibers or Type II muscle fibers. Whereas, in sprinters and weight lifters, these developments happen in gastrocnemius muscle of calf and in biceps.[18]
Plasma volume expansion usually occurs with endurance training and the magnitude of this expansion is generally of the range of 9–25%. This corresponds to the expansion of approximately 300–700 ml of plasma, although there is substantial variability in the magnitude and time course of the increase in plasma volume.[14,15]
Endurance training results into increased SV and CO both at rest and exercise. “Resting bradycardia” results as an effect of long-term endurance training due to increased parasympathetic and decreased sympathetic influence.[19,20] Endurance training in long term reduces both blood pressure and vascular resistance, which is associated with reduced sympathetic activation and lower catecholamines. On the other hand, no supportive literature could be found regarding changes imparted by RT on resting HR, blood pressure, or SV. Again, as per literature, deconditioning of baroreceptor response takes place in microgravity.[21]
As per study by Tomaselli et al. (1987),[22] Butler et al.,[23] and Banerjea,[24] HR decreased significantly during HDT. In our study, though the baseline HR was less in the ET group than the RT group, an increasing trend was found in the ET group as compared to a decreasing trend in the RT group. We did not observe any significant interaction effect of training and HDT on HR; however, this peculiar trend of HR observed in our study in contrary to available literature,[19,20] could not be explained.
Reduction in SBP and DBP during HDT had also been reported by Banerjea.[24] In our study, though the interaction effect of training and HDT on SBP was not found to be significant, both SBP and DBP showed significant increase in the ET group at the 4th h of HDT as compared to the 1st h and baseline, which, though seems to appear contrary to the effect of long-term endurance training,[19,20] might be attributed to increased cephalad fluid shift in the ET group. Hence, it may be inferred that the RT group better tolerated the effect of fluid shift than the ET group.
PP did not show significant temporal variation either during HDT. There was also no significant interaction effect of training and HDT on PP. This might be due to temporal increase in both SBP and DBP to similar degrees that prevented any change in PP throughout the period of HDT. Similar observation of unchanged PP throughout HDT has also been reported in a study by Tomaselli et al.[22]
MAP showed significant variation during HDT, though the interaction effect of training and HDT on MAP was not significant. Conflicting findings have been reported on MAP response during HDT; few studies showing a decline of MAP during HDT,[25] whereas others reporting an increase in MAP during HDT.[22] Some studies have also reported no significant variation of MAP during 4 h of 6° HDT in healthy males; however, their training status has not been mentioned.[23] In the present study, MAP showed significant increase in the ET group at the 4th h of HDT as compared to baseline and the 1st h of HDT. This increased MAP in the ET group was the result of increase in both SBP and DBP in this group. In the RT group, the relative constancy of MAP could be attributed to compensation by arterial baroreflex mechanisms through reduction of peripheral vascular resistance.[23]
Reduction in SV during the period of HDT had been reported in a study by Tomaselli et al.[22] This is in consonance with the results of our study, wherein, a significant temporal variation in reduction in SV was observed with HDT, though the interaction effect of training and HDT on SV was not found significant.
CO showed significant variation during HDT, though the interaction effect of training and HDT on CO was not significant. As per available literature, CO in μg initially increases followed by reduction.[2] In the present study, we have found that at the baseline, CO was slightly higher in the UT and RT groups than the ET group and it decreased throughout the period of HDT. However, the ET group shows no significant changes in CO. This finding signifies reduced sensitivity of baroreceptor in the ET group than both the UT and RT groups to perceive fluid overload induced by HDT.
The findings of the present study are in consonance with the existing literature that deconditioning of baroreceptor response takes place in microgravity.[21] The differences in cardiovascular dynamics may be attributed to varied sensitivity of baroreceptor in the UT, ET, and RT groups; among which the RT group showed more resilience in tolerating physiological changes of simulated microgravity condition for short duration, which are also in consonance with the previous studies conducted at this institute.[26,27] However, the level, duration, and extent of training of the participants in each group in the present study varied widely and this is considered as a limitation of the study.
CONCLUSION
Effects of physical training on cardiovascular parameters on exposure to simulated microgravity conditions of 4 h duration were evaluated. The study revealed that RT individuals demonstrated more resilience in terms of cardiovascular dynamics to simulated microgravity condition than ET individuals and UT individuals. While the present study suggests RT to be beneficial for short duration microgravity exposures, further research with larger sample size with extended duration of HDT would be more conclusive to make optimal recommendations for an ideal training schedule for astronauts for space missions.
Declaration of patient consent
The authors certify that they have obtained all appropriate consent from the participants of the study.
Financial support and sponsorship
Nil.
Conflicts of interest
There are no conflicts of interest.
References
- Space physiology and medicine In: Gradwell DP, Rainford DJ, eds. Ernsting's Aviation and Space Medicine (5th ed). New York: CRC Press; 2016. p. :336-8.
- [Google Scholar]
- Physiology of a microgravity environment, Historical perspectives: Physiology in microgravity. J Appl Physiol. 2000;89:379-84.
- [CrossRef] [PubMed] [Google Scholar]
- Impairment of cerebral blood flow regulation in astronauts with orthostatic intolerance after flight. Stroke. 2011;42:1844-50.
- [CrossRef] [PubMed] [Google Scholar]
- Fundamentals of Space Medicine. (2nd ed). Berlin, Germany: Space Technology Library, Springer; 2011. p. :39.
- [CrossRef] [Google Scholar]
- Long-duration bed rest as an analogue to microgravity. J Appl Physiol. 2016;120:891-903.
- [CrossRef] [PubMed] [Google Scholar]
- Fundamentals of Space Medicine (2nd ed). Berlin, Germany: Space Technology Library, Springer; 2011. p. :169-70.
- [Google Scholar]
- Comparison of non-exercise test and step test in estimation of aerobic capacity (VO2 max) in young adults. Natl J Physiol Pharm Pharmacol. 2014;4:218-20.
- [CrossRef] [Google Scholar]
- A cross-sectional study of association of body mass index and VO2 max by non-exercise test in medical students. Natl J Physiol Pharm Pharmacol. 2017;7:228-31.
- [CrossRef] [Google Scholar]
- Prediction of functional aerobic capacity without exercise testing. Med Sci Sports Exerc. 1990;22:863-70.
- [CrossRef] [PubMed] [Google Scholar]
- NASA Essentials of Personal Fitness Training Baltimore: Wolters Kluwer, Lippincott Williams & Wilkins; 2010. p. :103.
- [Google Scholar]
- Cross-validation of three jump power equations. Med Sci Sports Exerc. 1999;31:572.
- [CrossRef] [PubMed] [Google Scholar]
- Measuring and evaluating human energy-generating capacities during exercise In: Essentials of Exercise Physiology (4th ed). Philadelphia, PA: Wolters Kluwer, Lippincott Williams & Wilkins; 2011. p. :206.
- [Google Scholar]
- Cardiovascular responses to lower body negative pressure before and after 4 H of head-down bed rest and seated control in men and women. J Appl Physiol. 2012;113:1604-12.
- [CrossRef] [PubMed] [Google Scholar]
- Hormonal and plasma volume alterations following endurance exercise: A brief review. Sports Med. 1992;13:37-49.
- [CrossRef] [PubMed] [Google Scholar]
- Blood volume: Its adaptation to endurance training. Med Sci Sports Exerc. 1991;23:1338-48.
- [CrossRef] [PubMed] [Google Scholar]
- Enhancement of energy transfer capacity In: McArdle WD, Katch FI, Katch VL, eds. Exercise Physiology (7th ed). Philadelphia, PA: Wolters Kluwer, Lippincott Williams & Wilkins; 2010. p. :460-3.
- [Google Scholar]
- Cardiovascular adaptation to physical training. Ann Rev Physiol. 1977;39:221-51.
- [CrossRef] [PubMed] [Google Scholar]
- Fundamentals of Space Medicine (2nd ed). Berlin, Germany: Space Technology Library, Springer; 2011. p. :186.
- [Google Scholar]
- Effect of endurance exercise on autonomic control of heart rate. Sports Med. 2003;33:33-46.
- [CrossRef] [PubMed] [Google Scholar]
- Fundamentals of Space Medicine (2nd ed). Berlin, Germany: Space Technology Library, Springer; 2011. p. :151-70.
- [Google Scholar]
- Cardiovascular dynamics during the initial period of head-down tilt. Aviat Space Environ Med. 1987;58:3-8.
- [Google Scholar]
- Cardiovascular response to 4 hours of 6 degrees head down tilt or of 30 degrees head-up tilt bed rest. Aviat Space Environ Med. 1990;61:240-6.
- [Google Scholar]
- Studies on Cardiovascular Responses on Acute Exposure to-6 Deg Head Down Tilt in Human Volunteers MD Dissertation. Karnataka: Bangalore University; 1989.
- [Google Scholar]
- Blood pressure regulation IV: Adaptive responses to weightlessness. Eur J Appl Physiol. 2014;114:481-97.
- [CrossRef] [PubMed] [Google Scholar]
- Sympatho-vagal modulation of cardiovascular functions of aerobic and resistance trained individuals in simulated microgravity. Ind J Aerosp Med. 2014;58:1-7.
- [Google Scholar]
- Cardiovascular responses to orthostatic stress in endurance and resistance trained athletes after six hours of head-down bed rest. Ind J Aerosp Med. 2018;62:1-10.
- [Google Scholar]


