Translate this page into:
Middle Cerebral Artery Blood Flow during Simulated Push-Pull Effect
Abstract
Push-pull effect, since implicated in increased rate of G-LOC related mishaps, has been extensively studied in Acceleration Physiology. Even though the general consensus among the Acceleration Physiologists for the cause of decreased +Gz tolerance during Push-pull effect is divergently opposite hemodynamic stresses on cardiovascular reflexes, few studies have implicated the role of cerebral vasculature also. Hence this study was designed to understand the Middle Cerebral Artery (MCA) flow dynamics during Push-pull run. Ten healthy human volunteers have participated. Transcranial Doppler (TCD) of MCA was done during a +3Gz control run and a Push-pull run. The Push-pull epoch consisted of a -1.5Gz for 10 sec exposure immediately followed by comparable +Gz exposure. The mean and SD of peak systolic (PSV) and end diastolic (EDV) velocities during pre, +3Gz phase and post +Gz phase of control run and pre, -1.5Gz, +Gz and post +Gz phase of Push-pull run were analyzed. The PSVs of control run during baseline, +3Gz and post +3Gz phases were 99.4±18, 106±24 and 102.5±16 cm/sec respectively while that of Push-pull run were 99.5±43, 98.3±15 and 95.4±14 cm/sec respectively. Similarly the EDVs of control run were 42.7±11, 35.7±15 and 31.3±9 cm/sec and that of Push-pull run were 42.7±11, 21±13 and 26.8±12 cm/sec respectively. There were no significant differences in the peak systolic MCA velocities among the control and Push-pull runs. However, the end diastolic MCA velocity during +Gz phase is significantly slower in Push-pull run (p=0.002). The diastolic blood flow within the Push-pull run was significantly lower during -1.5Gz (p<0.05), +Gz (p<0.001) and post +Gz (p<0.05) phases compared to pre-run baseline. Decreased EDV during +Gz phase of Push-pull run can be attributed to persistent cerebral vasoconstriction during the +Gz period of Push-pull effect. This can be a contributing factor for decreased +Gz tolerance. The decreased EDV starting from -Gz phase till post +Gz phase of Push-pull run shows that the cerebral vasoconstriction had started during -Gz exposure and was persistent even during subsequent +Gz and post +Gz phases. This shows that there is a persisting phenomenon of increased cerebral vascular resistance starting from -Gz phase and extending to post +Gz phase of Push-pull run. Such a condition is not seen in pure +Gz exposures. This conclusively proves that a change in cerebral vasculature is definitely a contributing factor during Push-pull effect.
Keywords
Push-pull effect
Trans-cranial doppler
Middle cerebral artery
Peak systolic velocity
End diastolic velocity
Introduction
Modern fighter jets often engage in manoeuvres which lead to sudden changes in magnitude and direction of acceleration [1]. Such manoeuvres are inevitable to gain tactical advantage over the adversary. During that process some of them undergo rapid transition from negative (-Gz) to positive (+Gz) accelerations [2]. This phenomenon was termed as “Push-pull effect” by Banks et al considering the input on control stick during a bunt manoeuvre [3,4]. Several researchers had reported that such transitions would lead to significant decrements in +Gz tolerance which was directly related to magnitude and duration of preceding -Gz [3,5,6].
Push-pull effect was directly implicated in several G-LOC related accidents in leading air forces in the world such as U.S. Air Force, U.S. Navy and Canadian Air Force [7,8]. Michaud et al reported that 12.5-29% of USAF G-LOC associated accidents were related to Push-pull effect manoeuvres [7]. Surveys conducted in Royal Air Force and Canadian Air Force revealed that the mishaps were only tip of the ice berg of the actual threat, considering respectively the 31.3 % and 17% incidence of in-flight G-LOC attributed to Push-pull effect [9,10,11].
In spite of being an important threat to flight safety, the specific counter measures against this problem is yet to evolve. A better understanding of the patho-physiological mechanism behind this effect is mandatory to evolve effective measures. The physiological basis of this effect was studied by several researchers using tilt tables, Coriolis Acceleration Platforms and human centrifuges [1,2,3,5,6]. The prevailing consensus is that after – Gz exposure, there would be a significant delay in sympathetic baroreceptor mediated peripheral vascular resistance during subsequent +Gz phase resulting in decreased arterial BP which in turn contribute to reduction in +Gz tolerance during Push-pull effect [3,5,6,12,13]. However Zhang et al suggested, based on a tilt table study, that cerebral vasoconstriction may occur during –Gz to counteract the effects of over perfusion pressure in brain possibly due to autoregulation [14]. This reflex mediated cerebral vasoconstriction may possibly aggravate the already lowered cerebral perfusion due to decreased arterial pressure during Push-pull effect [2]. It may also jeopardise the natural mechanisms maintaining cerebral blood flow at higher +Gz such as carotid siphonic effect and effect of Monroe Kellie doctrine [15,16]. Hence the Push pull effect occurs due to early onset “cerebral ischemia” contributed by factors related to preceding –Gz exposure. Therefore studying blood flow characteristics of cerebral arteries during a simulated Push-pull effect in human centrifuge will enhance our understanding in this regard.
Transcranial Doppler ultrasound (TCD) allows measurement of blood flow velocity to be made from basal intracerebral vessels [17]. It helps in repeated, non-invasive assessment of cerebral artery blood flow dynamics [18]. A low frequency transducer (2MHz) is commonly used for measurement to enable sufficient transmission of ultrasound through the skull. A number of acoustic windows are used to provide access to different intracerebral vessels. Most commonly a temporal window, above the zygomatic arch, is used through which the terminal internal carotid artery, middle cerebral artery, anterior cerebral artery, and proximal posterior cerebral artery can be insonated [17]. Out of which MCA carries 80% of blood flow within each cerebral hemispheres [18].
TCD offers good temporal resolution and can track rapid changes in the blood flow dynamics that can be related to functional changes in the brain activity in near real time [17]. TCD has been successfully employed to determine cerebral circulatory changes during lower body negative pressure (LBNP) [19,20] and tilt table studies [14]. This study was undertaken to determine the blood flow characteristics in MCA using TCD during simulated Push-pull effect in a high performance human centrifuge in order to gain better understanding of cerebral blood flow and its contribution to reduction in +Gz tolerance if any, during Push-pull effect.
Methods
This was an experimental case-control study. The study design was approved by the Institute Ethics Committee.
Subjects
Subjects were ten healthy male non-aircrew volunteers. Informed written consent was obtained from each subject after explaining the details of the experiment and the risks involved. They were instructed to abstain from tobacco and alcohol about 24 hours prior to the experiment and to avoid coffee and strenuous exercise since morning on the day of experiment. They were also instructed to have adequate sleep on the previous night of the experiment.
High Performance Human Centrifuge (HPHC)
This study was conducted using the Human Centrifuge (HPHC®) at the Institute of Aerospace Medicine, Bangalore, India. The centrifuge arm is 8 meters; and the gondola is gimballed with active computer cab control. The profile for –Gz in the dynamic mode was simulated by 180o pitch down positioning of gondola, where the minimum magnitude of -Gz was -1.4Gz.
Transcranial Doppler (TCD) measurement
In this study the cerebral blood flow velocity was measured on the right middle cerebral artery (MCA) using a pulsed TCD technique. EZ-Dop V1.0h ® (M/S DWL Elektronische Systeme GmbH, Germany) was the TCD measurement system used. This has a single 2 MHz probe, which was fixed on the head using a head band mounting bracket after localizing the artery using right temporal window approach as shown in Figure-1. The recordings were performed at a set depth of 50mm from the surface. The probe was secured properly such that even minimal dislocation was prevented during centrifuge run.
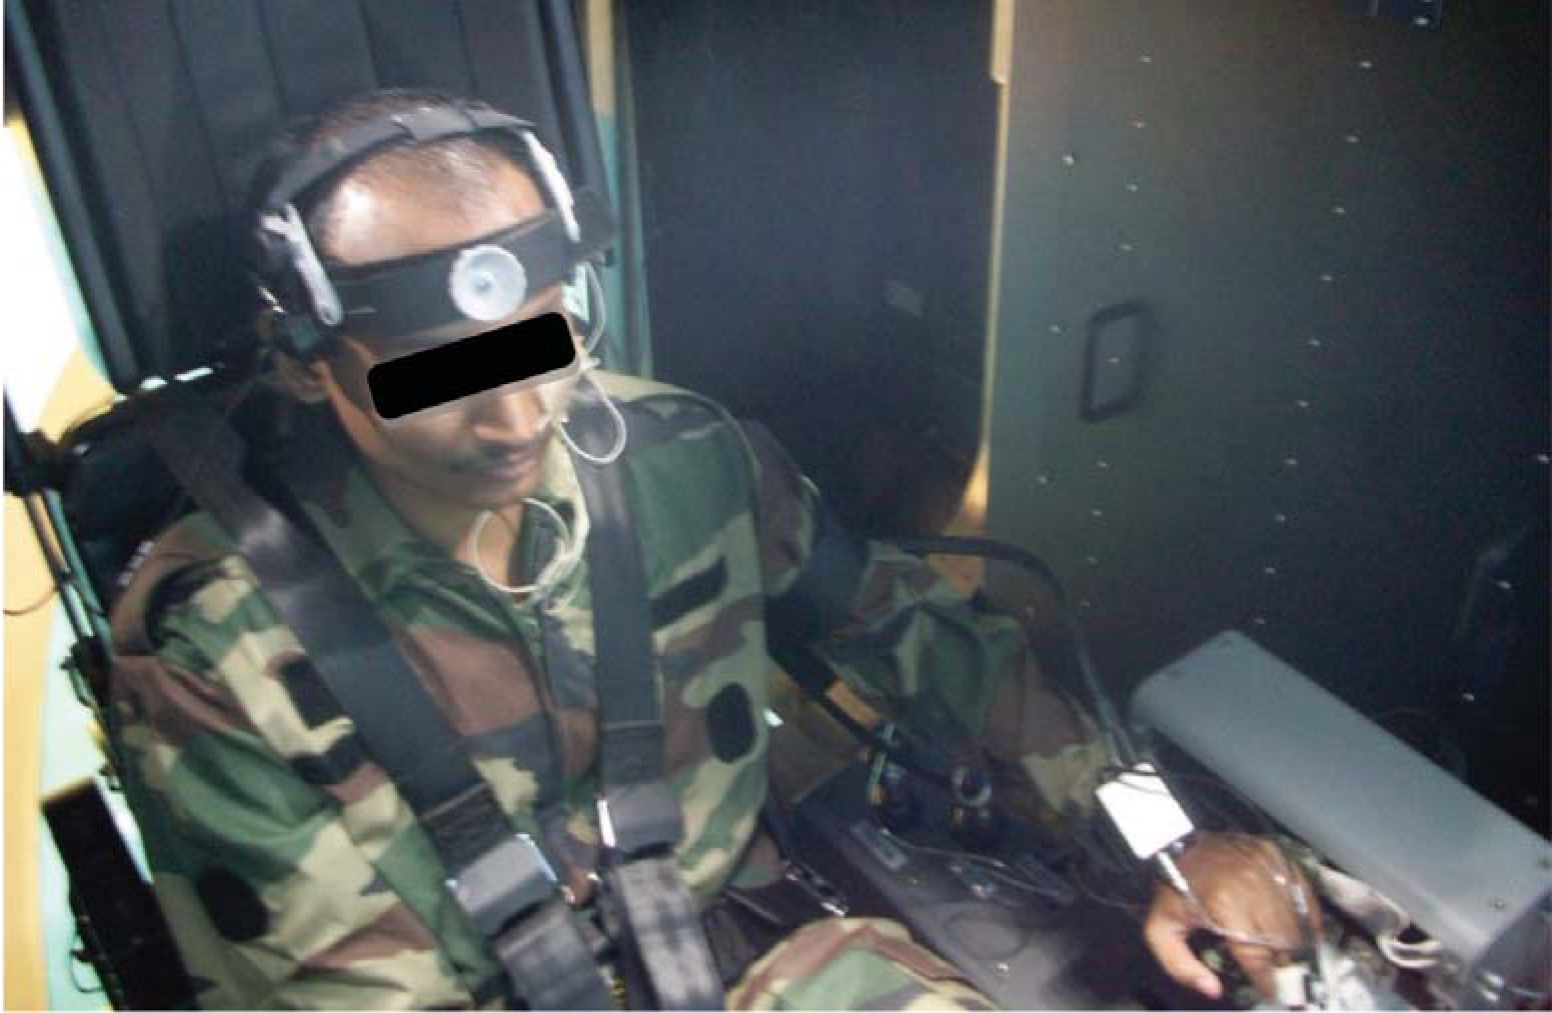
- Subject sitting in HPHC cockpit with TCD probe secured on head
Study Protocol
Each subject was given initially the control +Gz run followed by a push pull run. One minute baseline recordings were taken at +1Gz before and after each run. +Gz tolerance was determined as 52-56o PLL [21].
Control run had 15 sec epochs of +Gz starting from +3Gz followed by increments of 0.2Gz in subsequent epochs as shown in Fig-2(a). The push-pull run had a preceding 10 sec exposure of -1.5Gz for each +Gz epoch. It started from +2Gz with subsequent increments of 0.2Gz as shown in Fig-2(b). The onset and offset rate for both the runs were kept at 1G/sec. A 30 sec interval at baseline was provided after each epoch.
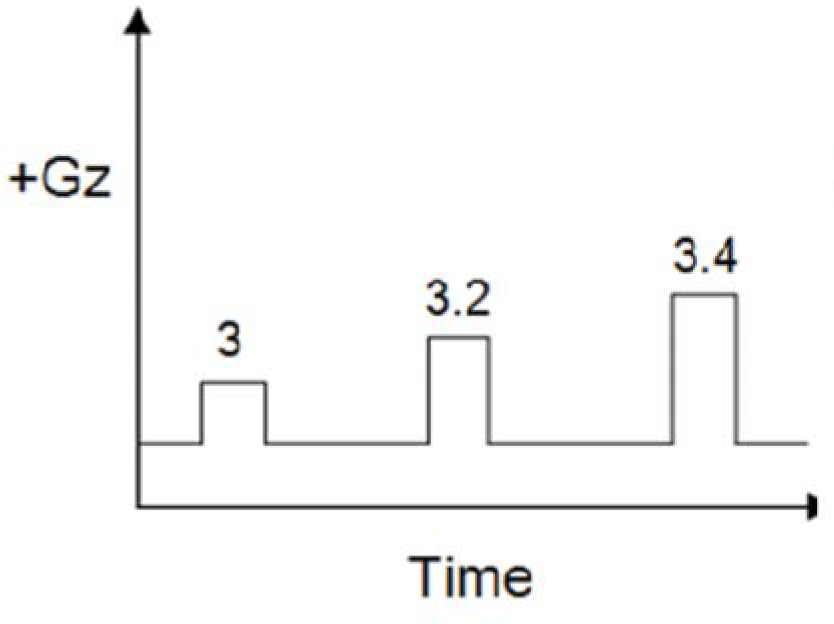
- +Gz run profile
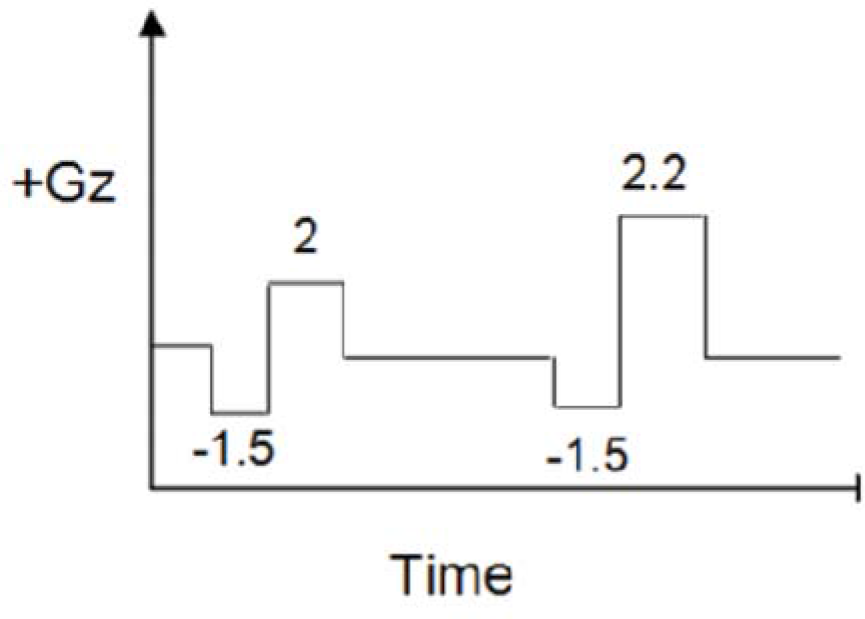
- Push-pull run profile
Data Analysis
The study protocol was part of a larger experiment comparing +Gz and Push-pull exposures. After the experiment TCD data was retrieved from the server computer for analysis. The recording around the +3Gz epoch of +Gz run and the recording around the Push-pull epoch with comparable +Gz level (closest of +3Gz) of Push-pull run was taken.
Statistical Analysis
Peak systolic and end diastolic velocities of MCA measured by TCD were tabulated for +Gz control run and Push-pull run. Velocities were tabulated as that of baseline, +Gz phase and post +Gz phase of +3Gz run and, baseline, -Gz phase, +Gz phase and post +Gz phase of Push-pull run. Velocities during the corresponding phases of both the runs were compared using Student’s two tailed paired ‘t’ test. Comparison of MCA velocity changes within each profile is done using one-way Anova followed by Tukey’s post hoc analysis. Level of significance (p) was kept less than 5%.
Results
10 healthy male volunteers participated in the study. Their mean age, mean height and mean weight were 30.1(±5.6) yrs, 170.4(±4.8) cm and 67.1(±6.9) kg, respectively. All the control run MCA velocity readings were taken during +3Gz.
However, during the Push-pull run none of the subjects reached the +3Gz level due to decreased +Gz tolerance. So the Push-pull exposure with highest level of +Gz was taken for analysis. The mean and standard deviation +Gz level of Push-pull run was +2.53(±0.14) Gz.
When the TCD was analysed after the study almost all subjects had shown a similar trend in a particular profile as shown in Figure 3(a) and 3(b). Figure-3(a) shows the TCD response in a subject during +3Gz exposure. It showed that the MCA blood flow velocity dipped during the initial part of +Gz exposure, came back to baseline by 8-10 sec of onset of +Gz, again dipped down in the latter half of +Gz exposure and was bounced back above baseline after the offset of +Gz exposure. Figure-3(b) shows the TCD response during Push-pull exposure. MCA blood flow showed a sudden peak during the initial part of –Gz phase followed by a gradual decrease below baseline in the subsequent part of –Gz, then during the subsequent +Gz phase, the peak systolic velocity returned to normal level while the end diastolic velocity remained at the previous lower level. Immediately after offset of +Gz both the velocities bounced above baseline and then gradually returned to baseline.
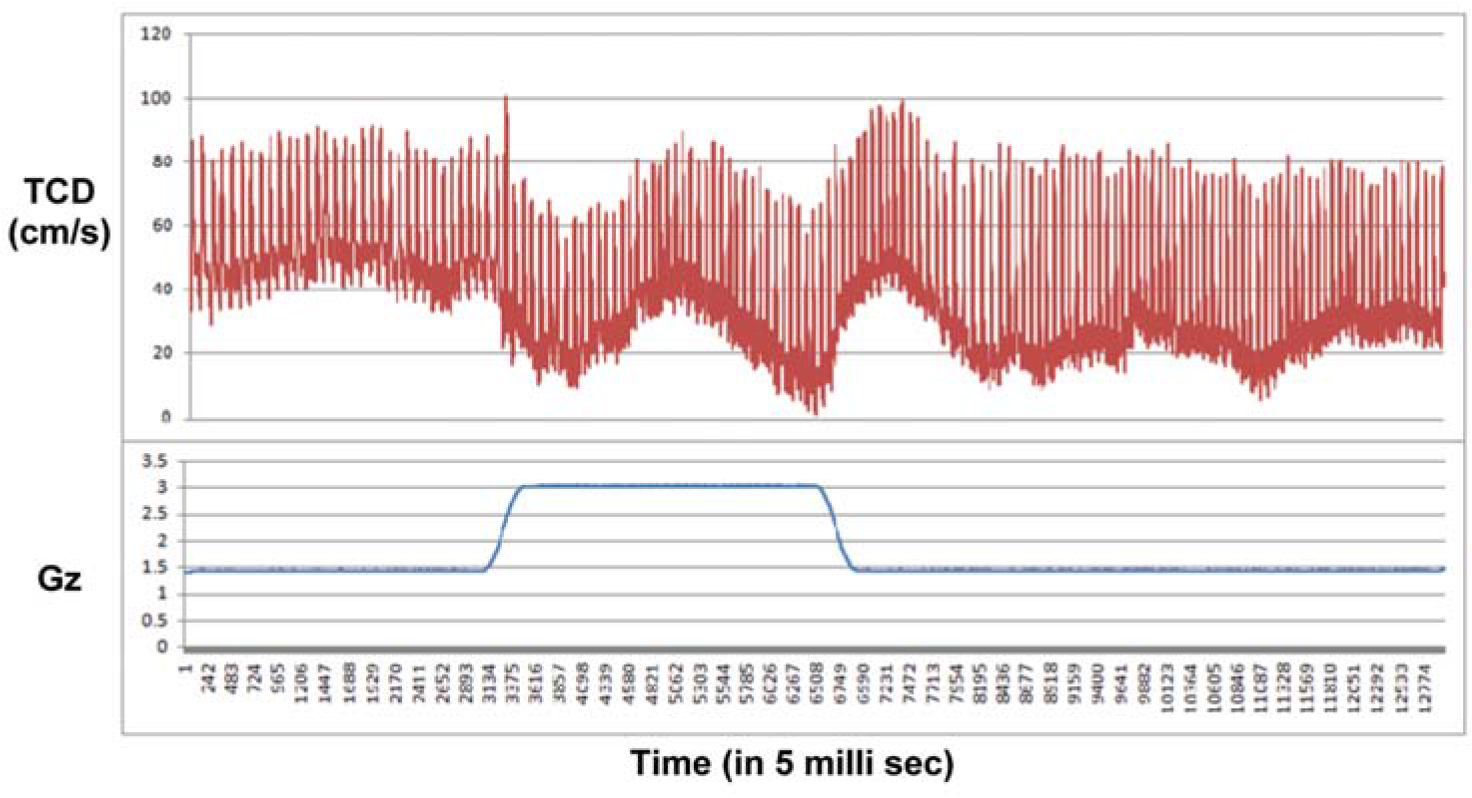
- TCD response during +3Gz exposure
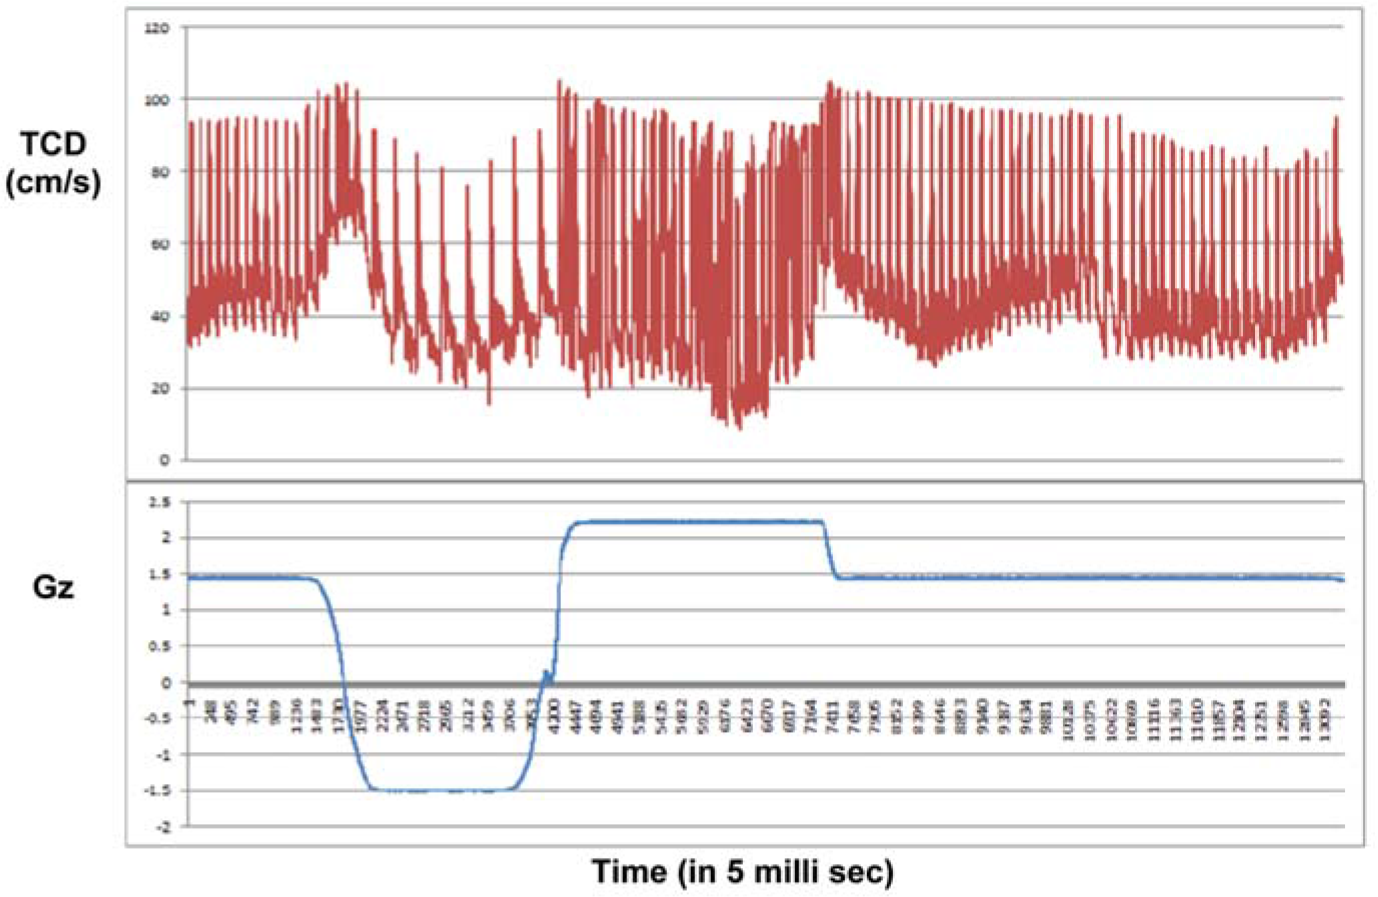
- TCD response during Push-pull exposure The reflexogenic bradycardia during –Gz phase and tachycardia during +Gz phase is very evident during Push-pull run
Table-1 represents comparison of the mean and standard deviations of peak systolic and end diastolic MCA velocities during pre-run baseline, during the +Gz phase and after the +Gz phase in cm/sec for both +3Gz run and Push-pull run. The end diastolic velocity (EDV) during +Gz phase of Push-pull run was found to be significantly less (p=0.002) compared to that of control run. There is no significant difference in the peak systolic velocity (PSV).
| Phase of run | MCA velocity type(cm/sec) | +3Gz run(Mean±SD) | Push-pull run(Mean±SD) | P value |
|---|---|---|---|---|
| Base line | PSV | 99.4±18 | 99.5±43 | 0.95NS |
| EDV | 42.7±11 | 42.7±11 | 1.0NS | |
| +Gz | PSV | 106±24 | 98.3±15 | 0.44NS |
| EDV | 35.7±15 | 21±13 | 0.002** | |
| Post +Gz | PSV | 102.5±16 | 95.4±14 | 0.27NS |
| EDV | 31.3±9 | 26.8±12 | 0.36NS |
NS: Not significant; ** Highly significant
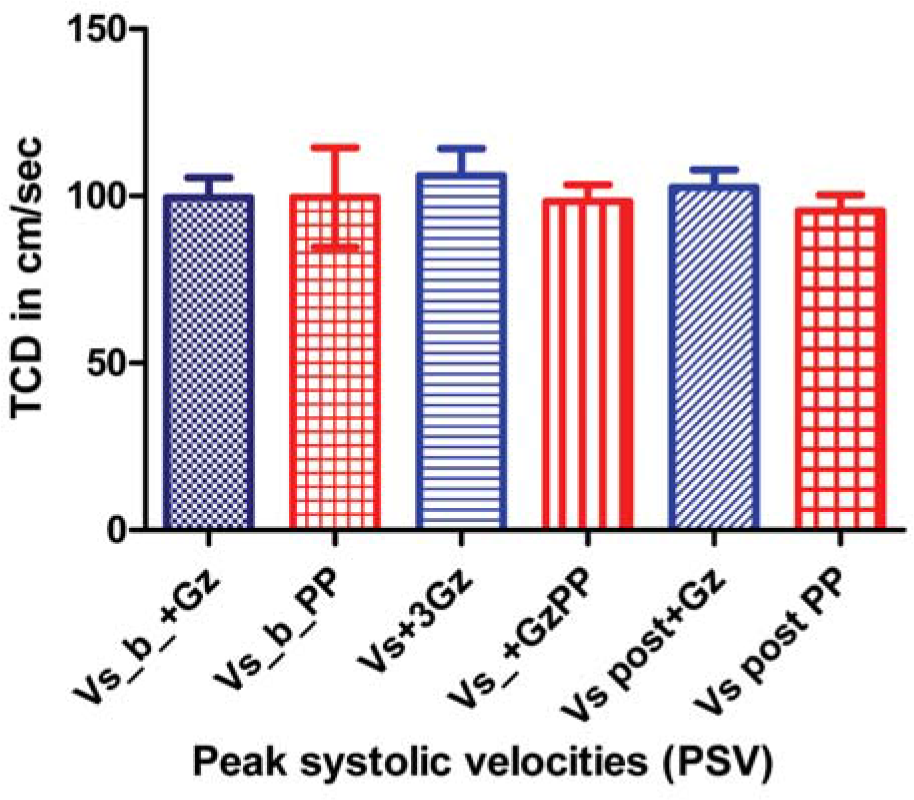
- Comparison of peak systolic velocities in different phases of control and Push-pull runs
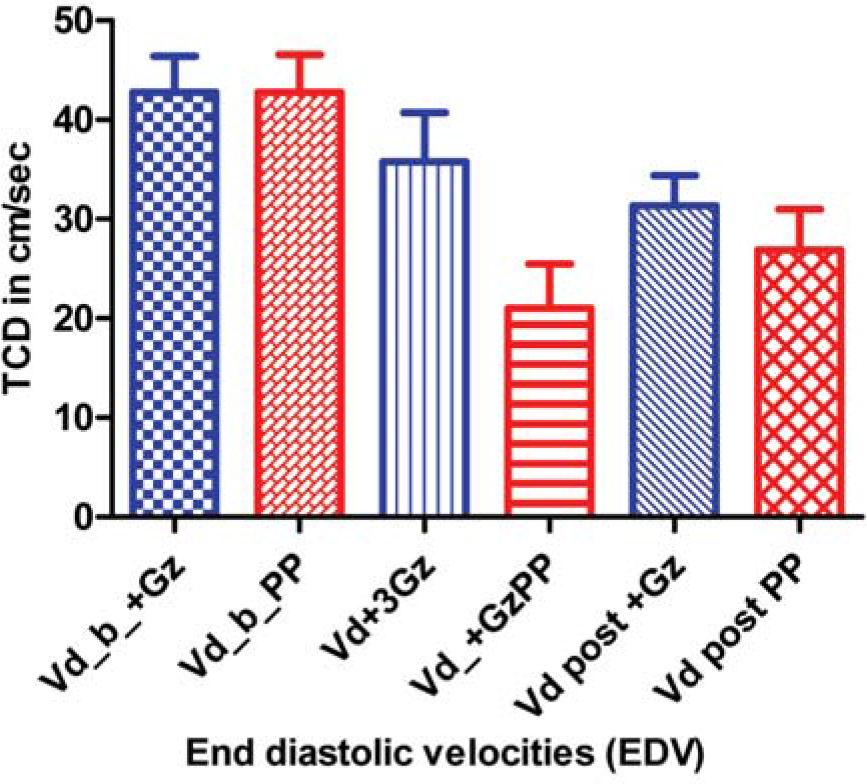
- Comparison of End diastolic velocities in different phases of control and Push-pull runs
Table-2 shows comparison of mean and standard deviations of peak systolic and end diastolic MCA velocities during pre-run baseline, +3Gz phase and post +3Gz phase of Control run. The PSVs during different phases of control run did not change significantly, while the EDV during post +Gz phase was significantly less compared to that of baseline.
| Parameters | Mean ± SD (cm/sec) | P value |
|---|---|---|
| PSV_baseline Vs PSV_+Gz | 99.4±18 Vs 106±24 | NS |
| PSV_baseline Vs PSV_Post+Gz | 99.4±18 Vs 102.5±16 | NS |
| PSV_+Gz Vs PSV_Post+Gz | 106±24 Vs 102.5±16 | NS |
| EDV_baseline Vs EDV_+Gz | 42.7±11 Vs 35.7±15 | NS |
| EDV_baseline Vs EDV_Post+Gz | 42.7±11 Vs 31.3±9 | <0.05* |
| EDV_+Gz Vs EDV_Post+Gz | 35.7±15 Vs 31.3±9 | NS |
Table-3 shows comparison of mean and standard deviations of peak systolic and end diastolic MCA velocities during pre-run baseline, -Gz phase, +Gz phase and post +Gz phase of Push-pull run. The PSVs during different phases of the run did not change significantly, while the EDVs of –Gz, +Gz and post +Gz phases were found to be significantly lower than that of baseline.
| Parameters | Mean ± SD (cm/sec) | P value |
|---|---|---|
| PSV_baseline Vs PSV_-Gz | 99.5±43 Vs 108±20 | NS |
| PSV_baseline Vs PSV_+Gz | 99.5±43 Vs 98.3±15 | NS |
| PSV_baseline Vs PSV_Post+Gz | 99.5±43 Vs 95.4±14 | NS |
| PSV_-Gz Vs PSV_+Gz | 108±20 Vs 98.3±15 | NS |
| PSV_-Gz Vs PSV_Post+Gz | 108±20 Vs 95.4±14 | NS |
| PSV_+Gz Vs PSV_Post+Gz | 98.3±15 Vs 95.4±14 | NS |
| EDV_baseline Vs EDV_-Gz | 42.7±11 Vs 27.5±8 | <0.05* |
| EDV_baseline Vs EDV_+Gz | 42.7±11 Vs 21±13 | <0.001** |
| EDV_baseline Vs EDV_Post+Gz | 42.7±11 Vs 26.8±12 | <0.05* |
| EDV_-Gz Vs EDV_+Gz | 27.5±8 Vs 21±13 | NS |
| EDV_-Gz Vs EDV_Post+Gz | 27.5±8 Vs 26.8±12 | NS |
| EDV_+Gz Vs EDV_Post+Gz | 21±13 Vs 26.8±12 | NS |
Discussion
The blood flow velocities recorded before, during and after the +3Gz plateau of the control run was used for comparison with the test run viz. Push-pull run.
During the control run of pure +3Gz, the TCD tracing (see Fig-3a) showed an initial dip in the both the velocities during the onset of +Gz, which is due to sudden decrease in the blood flow above the heart level [15]. After 8-10 sec the MCA velocity reaches to normal level both because of baroreceptor mediated sympathetic vasoconstrictor response and cerebral autoregulation [15,16]. However the response was not persistent and the velocities were gradually decreasing on the latter half of +Gz exposure due to progressively decreased cardiac output under +Gz exposure [15]. When the mean peak systolic (PSV) and end diastolic (EDV) velocities were compared, there were no significant difference between baseline and +Gz phase. It means that during short exposures of +Gz (up to 15sec as in this case), there is no significant changes in cerebral blood flow. In the post +Gz phase, the PSV returned back to baseline, while the EDV was found to be persistently lower and the mean decrement EDV in post +Gz phase was found to be significant (p<0.05) compared to mean EDV of baseline and +Gz phase. This may be due to reflex cerebral vasoconstriction due to sudden surge of blood to the brain due to increase in cardiac output after the rapid offset of +Gz.
Cerebral blood flow is “autoregulated” extremely well between arterial pressure limits of 60 and 140 mmHg. That is, mean arterial pressure can be decreased acutely to as low as 60 mm Hg or increased to as high as 140 mm Hg without significant change in cerebral blood ûow. But, if the arterial pressure falls below 60 mmHg, cerebral blood flow then does become severely decreased [22].
The cerebral circulatory system has strong sympathetic innervation that passes upward from the superior cervical sympathetic ganglia in the neck and then into the brain along with the cerebral arteries. This innervation supplies both the large brain arteries and the arteries that penetrate into the substance of the brain. However, transaction of the sympathetic nerves or mild to moderate stimulation of them usually causes very little change in cerebral blood ûow because the blood ûow autoregulation mechanism can override the nervous effects [22]. When mean arterial pressure rises acutely to an exceptionally high level, such as during strenuous exercise or during other states of excessive circulatory activity, the sympathetic nervous system normally constricts the large- and intermediate-sized brain arteries enough to prevent the high pressure from reaching the smaller brain blood vessels [22].
In the Push-pull run (see Fig-3b), MCA velocities were increased at the onset of –Gz due to sudden flow of cardiac output to the brain. Then both PSV and EDV gradually decrease below baseline as the cerebral autoregulation sets in. The decreased in PSV was not significant. But there was significant (p<0.05) decrease in EDV compared to baseline. This can be attributed to the onset of reflex cerebral vasoconstriction resulting from “autoregulation” (12,15,16). During the subsequent +Gz phase, the PSV remained at the baseline reading, while the EDV remained significantly (p<0.001) below baseline value. This shows that the reflex cerebral vasoconstriction response occurred during the –Gz phase was persistent during the 15sec duration of subsequent +Gz phase. The EDV remained significantly (p<0.05) low during post +Gz phase also. This finding conclusively proves that the cerebral vasoconstriction occurs during the –Gz phase of Push-pull manoeuvre is persistent and continues during and even after the subsequent +Gz phase. These findings were similar to those reported by Zhang et al [14] during tilt table simulation of Push-pull effect.
When the PSVs and EDVs of the control run were compared with that of Push-pull run, there were no significant differences in the velocities except in EDV of +Gz phase. The EDV of Push-pull run was significantly (P=0.002) lower in +Gz phase compared to that of control run. This can be attributed to the persistent reflex mediated cerebral vasoconstrictor response, as explained earlier, characteristically seen in Push-pull run.
Limitation of the Study
The study was conducted in a small sample size (10 subjects). This was mainly because of difficulty in achieving TCD recording under high G, especially during the Push-pull run. Several incidents of misplacements of the probe were noted and such runs were terminated and data was discarded from the study. Another important issue is the +Gz levels used for comparison between the runs. For the control run profile, the lowest +Gz epoch available for comparison was +3Gz. While during the Push-pull run, all of the subjects reported PLL before attaining +3Gz level. Hence, the highest +Gz level achieved during Push-pull profile was taken for comparison in order to achieve as closer to +3Gz. Due to the non-availability of software, the mean velocity and other derived indices of cerebral blood flow like Resistance index, Pulsatality were not been studied.
Conclusion
Push-pull effect and the underlying physiological changes have generated vast interest among Acceleration physiologists. Some of those studies pointed out that cerebral vasculature also play an important contributing role during Push-pull effect. Hence this study was conducted to conclusively determine the role of cerebral vasculature and to study the cerebral blood flow dynamics under Push-pull effect. Unlike the systolic flow, the diastolic blood flow during +Gz phase of Push-pull run was found to have significantly decreased in this study. This could be attributed to persisting cerebral vasoconstriction, thus proving that that the cerebral vasculature plays a significant role to reduce +Gz tolerance during Push-pull effect.
References
- Centrifuge training program with “push-pull” elements. Aviat Space Environ Med. 2005;76:493-5.
- [Google Scholar]
- Carotid sinus pressure changes during push-pull maneuvers. Aviat Space Environ Med. 2006;77:921-8.
- [Google Scholar]
- “Bunt bradycardia”: Two cases of slowing of heart rate inflight during negative Gz. Aviat Space Environ Med. 1994;65:330-1.
- [Google Scholar]
- The effect of varying time at-Gz on subsequent +Gz physiological tolerance (push-pull effect) Aviat Space Environ Med. 1995;66:723-7.
- [Google Scholar]
- Heart rate and blood pressure responses to +Gz following varied duration–Gz. Aviat Space Environ Med. 2000;71:137-41.
- [Google Scholar]
- “push pull effect” and G-induced loss of consciousness accidents in the US Air Force. Aviat Space Environ Med. 1998;69:1104-6.
- [Google Scholar]
- Human response to acceleration In: Davis JR, Johnson R, Stepanek J, Fogarty JA, eds. Fundamentals of Aerospace Medicine (4th ed). 2008. p. :83-109.
- [Google Scholar]
- G-induced loss of consciousness: retrospective survey results from 2259 military aircrew. Aviat Space Environ Med. 2006;77:619-23.
- [Google Scholar]
- Operational implications of Push-pull effect. Aviat Space Environ Med. 1997;68:614.
- [Google Scholar]
- Physiological consequences: cardiopulmonary, vestibular and sensory aspects Human consequences of agile aircraft RTO-TR- 015, Neuilly-sur-Seine, France Research and technology organization. In: NATO. 2001. p. :49-58.
- [Google Scholar]
- Impairment of cardiovascular and vasomotor responses during tilt table simulation of “push-pull” maneuvers. Aviat Space Environ Med. 2002;73:971-9.
- [Google Scholar]
- Decreased + Gz tolerance following lower body positive pressure: simulated push pull effect. Aviat Space Environ Med. 2001;72:1045-7.
- [Google Scholar]
- Cerebral flow velocity by transcranial Doppler during a vertical-rotating table simulation of push-pull effect. Aviat Space Environ Med. 2000;71:485-8.
- [Google Scholar]
- Effects of long duration acceleration In: Rainford DJ, Gradwell DP, eds. Ernsting’s Aviation Medicine (4th ed). New York: Edward Arnold Ltd; 2006. p. :137-58.
- [Google Scholar]
- Circulation through special regions Review of medical physiology. In: McGraw-Hill companies (22nd ed). 2005. p. :611-29.
- [Google Scholar]
- Transcranial Doppler Sonography In: Parasuraman R, Rizzo M, eds. Neuroergonomics: The brain at work. New York: Oxford university press. Inc; 2007. p. :82-94.
- [Google Scholar]
- Cerebral artery blood flow velocity changes following rapid release of lower body negative pressure. Aviat Space Environ Med. 1996;67:19-22.
- [Google Scholar]
- Effect of lower body negative pressure on cerebral circulation. Aviat Space Environ Med. 1993;64:1006-10.
- [Google Scholar]
- Positive G tolerance of Indian subjects-Effect of age and flying experience. Aviation Medicine. 1982;26(2):100-4.
- [Google Scholar]
- Cerebral blood flow, cerebrospinal fluid and brain metabolism. Text book of Medical Physiology. (11th ed). Elsevier Saunders; 2006. p. :761-8.
- [Google Scholar]


