Translate this page into:
Cardiovascular Responses to Orthostatic Stress in Endurance and Resistance Trained Athletes after Six Hours of Head-Down Bed Rest
Abstract
Introduction:
Exercise training results in a number of cardiovascular adaptations specific to the nature of exercise program used. Endurance exercise training and resistance exercise training modulate the Cardiovascular System (CVS) differently. Endurance training is accompanied by a large increase in stroke volume and cardiac output during rest and exercise. Whereas, resistance training results in little to no change in cardiac output. The morphological and functional changes that occur during endurance training confer some advantages to athletic performance, however, endurance trained individuals are more prone to develop orthostatic hypotension during orthostatic stress. This intolerance becomes more prominent after an exposure to simulated microgravity condition. The similar cardiovascular deconditioning is not observed in resistance trained individuals. With an aim to examine the differences in CVS responses to orthostatic stress in endurance and resistance trained athletes, the present study was carried out where the individuals were subjected to 6-hr simulated microgravity condition in the form of Head-Down Bed Rest (HDBR).
Methods:
Healthy male volunteers from an army unit formed the study group. The participants were segregated into two subgroups i.e. Endurance Trained (ET) and Resistance Trained (RT), each consisting of 12 participants. In the first session, the baseline CVS response to orthostatic stress was measured by Head-Up Tilt Test (HUTT) in an automated tilt table at an angle of 70° from the horizontal position. Two days later, the participants were subjected to 6 hr of HDBR at an angle of -6° from the horizontal position. The Physiological parameters like Heart Rate (HR), Systolic Blood Pressure (SBP), Diastolic Blood Pressure (DBP), Mean Arterial Pressure (MAP) and Baroreflex Sensitivity (BRS) were recorded during HUTT before and after HDBR and were compared between two groups.
Results:
The Heart rate increased significantly during orthostatic stress from baseline supine in the ET group (34-39%) in comparison to the RT group (20-21%). The RT group had a significantly higher SBP, DBP and MAP during the post HDBR HUTT. The BRS was found to be reduced during orthostatic stress and becomes more pronounced in the ET group. There was also a decrease in BRS value in the ET group during a post HDBR orthostatic stress indicating of heightened sympathetic activity.
Conclusion:
Cardioacceleration, heightened sympathetic activity and a comparatively lower blood pressure during orthostatic stress may lead to more CVS deconditioning in endurance trained athletes as compared to resistance trained athletes. While selecting and imparting exercise training to astronauts, the importance of administering specific type of exercise regime should be considered carefully.
Keywords
Orthostatic Tolerance
Endurance Training
Resistance Training
Baroreflex Sensitivity
Head-Down Bed Rest

INTRODUCTION
One of the major physiological challenges during spaceflight is Cardiovascular (CVS) deconditioning. Although this CVS deconditioning does not impose major threat to the crew performance during the flight, it is a matter of great concern on return to earth due to orthostatic stress. Orthostatic intolerance affects about two thirds of the astronauts returning from spaceflight, even after a space flight of short duration. Head-Up Tilt Test (HUTT) is an important simulation technique for simulating orthostatic stress. Similarly, Head-Down Bed Rest (HDBR) is a technique which is employed to simulate various effects of microgravity. This is because of the fluid shift during HDBR closely mimics the one that happens in the actual microgravity conditions.
The physiological conditioning that occurs in Endurance Trained (ET) people is quite different from that of Resistance Trained (RT) people, the physiological response during orthostatic intolerance especially in a simulated microgravity condition is yet to be established. It is postulated that the associated physiological changes due to headwards fluid shift could be different in ET and RT individuals. Earlier study reported that the ET individuals had more intolerance to orthostatic stress in comparison to RT individuals [1]. Study by Stevens et al. also suggested that the physiological adaptations like increase in V̇O2 max and total blood volume resulting from an 8 month endurance exercise training programme could reduce the orthostatic tolerance to LBNP stress in healthy young men [2]. On the contrary, Greenleaf et al. reported that though the effect of six months of moderate aerobic training caused an increase in aerobic capacity, it had no effect on tilt tolerance following six-hour of water immersion up to the neck [3].
Study conducted by Mc Carthy et al. concluded that the short term resistance training for 12 weeks did not show any improvement in the orthostatic tolerance of a sedentary man [4]. However, long term resistance training for 2-3 years could confer better tolerance to LBNP stress [5]. The scientific literature is also at variance in establishing the exact role of exercise and various related factors like frequency, duration, intensity and mode of exercise training in preventing orthostatic stress.
With a hypothesis that RT individuals will have more tolerance to orthostatic stress than their ET counterparts, the present study was conducted to evaluate the cardiovascular responses to orthostatic stress in them. Also, the physiological responses during orthostatic intolerance especially in a simulated microgravity condition are not well established. The present study also aims to determine the cardiovascular responses to orthostatic stress before and after a six hour of HDBR, both in ET as well as RT individuals.
MATERIAL AND METHODS
Twenty four healthy male athletes from a local Indian Army Unit were selected for the study. Based on their type of physical training, the personnel were divided into two groups i.e. Endurance Trained (ET) and Resistance Trained (RT). ET participants were selected from swimmers and cross-country runners and RT participants from body builders and weight lifters. Each group had 12 participants. It was ensured that participants were in medical category of SHAPE-1 and had no major disease or disability at the time of recruitment for the study. Voluntary informed consent was obtained from each participant.
The study was conducted in two sessions. During the first session, the participants’ CVS response to orthostatic stress was measured by subjecting them to Head-Up Tilt Test (HUTT) for 20 min. During the second session, after a gap of 2 days, they were subjected to Head-Down Bed Rest (HDBR) for 6 hours and their CVS response to orthostatic stress was recorded again for 20 minutes. The protocol followed for HUTT is available at the department of Space and Environment Physiology at IAM and has been used extensively in various studies in the past [6]. Similarly, the automated tilt table was inclined to an angle of 6° head-down from the horizontal position for conducting HDBR. The HDBR has been accepted as a ground-based simulation model for creating microgravity effect [7].
Akron multipurpose automated tilt table (Model 9622, Huntleigh Akron, UK) was used both for HUTT and HDBR. The study was conducted between 0800 h to 1400 h. The participants were advised to complete their breakfast at least 2 hours prior to tests and were kept fasting throughout the experiment. The participants were given only 100 ml water every 2 hours (if required) in order to avoid urination during head-down position.
The cardiovascular parameters were recorded for 10 min at horizontal supine position and for 20 min during HUTT. HUTT was carried out before and after HDBR. Finger arterial blood pressure was measured on a beat-to-beat basis by an arterial tonometer (Finometer MidiFinapres Medical System, Amsterdam, Netherland). Systemic brachial arterial blood pressure was reconstructed from the recorded finger pressure using the Beatscope software of Finapres arterial tonometer. The Systolic Blood Pressure (SBP), Diastolic Blood Pressure (DBP), Pulse Pressure (PP) and Mean Arterial Pressure (MAP) were measured and were expressed in mmHg. Various scientific studies have reported that the finger arterial pressure measured by Finapres correlates well with the brachial arterial pressure in clinical as well as experimental settings [8-9]. Heart Rate (HR) data was calculated from the finger arterial pulse wave. Stroke Volume (SV), Cardiac Output (CO), Peripheral Resistance (PR), Aortic Impedance (AI) and Arterial Compliance (AC) were also computed from arterial pressure wave by the software-based technique called Model Flow Method [10]. Baroreflex Sensitivity (BRS) was computed by the sequence method [11]. BRS is defined as the change in interbeat interval in milliseconds per unit change in BP. BRS was calculated from beat-to-beat blood pressure data and the corresponding interbeat interval of the arterial pressure wave. Sequences of three or more beats in which the SBP and the following pulse interval changed in the same direction (either increasing or decreasing), which reflect the HR response to spontaneous variations in BP, were considered as BRS. The BRS data was analyzed by using Blood Pressure Variability Analysis Software NEVROKARD 9.0.0 (Slovenia) and was expressed as ms/ mmHg.
Data was analysed by using a statistical software ‘Statistica 6.0’. A Mixed between-within subjects repeated measure Analysis of Variance was carried out to analyse the data. Between subject factor was two different groups (ET and RT group) and within-subject factor was three different time points (baseline and HUTT (in phase 1) and post HDBR HUTT in phase 2). Tukey HSD test was carried out to compare the individual data. The level of significance was kept at P<0.05.
RESULTS
The mean age, height and weight of the ET group were 21.5±3.45 years, 60.7±4.20 kg and 170.0±5.08 cm and those of the RT group were 22.4±1.68 years, 80.7±9.45 kg and 171.0±6.46 cm respectively.
Table 1 shows baseline cardiovascular parameters of ET and RT group. None of the parameters were significantly different between two groups at the baseline. The CVS response to HUTT of two groups before and after HDBR are also shown Table 1. RT group had a significantly higher PP (P<0.01) and lower AC (P<0.05) during orthostatic stress before HDBR. RT Group had a significantly higher SBP (P<0.001), DBP (P<0.05), PP (P<0.05) and MAP (P<0.01).
| Parameters | Baseline | HUTT before HDBR | HUTT after HDBR | ||||||
|---|---|---|---|---|---|---|---|---|---|
| ET Group | RT Group | P-Value (Level of Signifi- cance) | ET Group | RT Group | P-Value (Level of Signifi- cance) | ET Group | RT Group | P-Value (Level of Signifi- cance) | |
| Heart Rate(bpm) | 60.8±4.86 | 64.8±7.37 | 0.95 (NS) | 81.5±6.34 | 78.1±11.00 | 0.98 (NS) | 84.4±8.47 | 77.9±10.81 | 0.55 (NS) |
| Systolic Blood Pressure(mm Hg) | 109.8±9.14 | 116.7±9.20 | 0.99 (NS) | 115.2±16.65 | 135.3±19.04 | 0.06 (NS) | 127.3±18.50 | 159.2±32.87 | 0.000 (S) |
| Diastolic Blood Pressure(mm Hg) | 64.8±11.27 | 68.2±7.73 | 0.99 (NS) | 76.7±16.55 | 88.2±16.49 | 0.40 (NS) | 89.5±18.91 | 106.5±14.29 | 0.03 (S) |
| Pulse Pressure(mm Hg) | 44.9±7.12 | 47.1±7.76 | 0.99 (NS) | 38.5±3.88 | 47.1±5.84 | 0.003 (S) | 37.7±4.03 | 44.3±4.70 | 0.05 (S) |
| Mean Arterial Pressure(mm Hg) | 81.4±9.72 | 85.2±7.98 | 0.99 (NS) | 90.8±16.17 | 104.9±16.82 | 0.14 (NS) | 103.3±18.77 | 121.7±13.45 | 0.01 (S) |
| Stroke Volume (ml/ beat) | 80.9±16.30 | 88.9±19.54 | 0.92 (NS) | 55.9±12.32 | 64.2±14.60 | 0.12 (NS) | 46.9±11.65 | 48.7±14.18 | 0.99 (NS) |
| Cardiac Output(L/min) | 4.8±0.80 | 5.7±1.34 | 0.56 (NS) | 4.5±0.96 | 4.8±1.14 | 1.00 (NS) | 3.9±1.00 | 3.8±1.17 | 0.99 (NS) |
| Peripheral Resistance(MU) | 1.12±0.41 | 1.1±0.42 | 1.00 (NS) | 1.34±0.65 | 1.5±0.54 | 0.94 (NS) | 1.87±0.91 | 2.3±0.92 | 0.79 (NS) |
| Aortic Impedance(MU-Medical Unit) | 48.5±14.20 | 46.9±3.40 | 0.99 (NS) | 52.9±1.77 | 48.6±5.70 | 1.00 (NS) | 57.5±3.57 | 51.3±7.46 | 0.25 (NS) |
| Arterial Compliance (mMU- Milli Medical Unit) | 2.53±0.23 | 2.50±0.56 | 0.99 (NS) | 2.35±0.29 | 2.0±0.52 | 0.02 (S) | 1.87±0.37 | 1.7±0.45 | 0.99 (NS) |
ET: endurance trained; RT: resistance trained; NS: not significant; S: significant
The cardiovascular parameters like HR, SBP, DBP, PP, MAP, SV, CO, PR, AI and AC during orthostatic stress before and after HDBR in the ET group are shown in Table 2. HR increased significantly from baseline to pre-HDBR HUTT (P<0.001) and post-HDBR HUTT (P<0.001). DBP increased significantly in post-HDBR HUTT from BL (P<0.001). PP decreased significantly during HUTT before HDBR (P<0.05) and after HDBR (P<0.01). MAP increased significantly in HUTT after HDBR only (P<0.001). A significant reduction in SV was observed during HUTT (from 80.9 ml/beat at baseline to 55.9 ml/beat before HDBR and 46.9 ml/beat after HDBR). AI increased significantly during HUTT from baseline after HDBR (from 48.5 MU to 57.5 MU). AC reduced significantly during HUTT after HDBR (from 2.53 mMU at baseline to 1.87 mMU).
| Parameters | BL | HUTT before HDBR | Early HDBR | Late HDBR | HUTT after HDBR |
|---|---|---|---|---|---|
| HR (bpm) | 60.8±4.86 | 81.5±6.34*** | 62.5±6.82 | 61.4±4.17 | 84.4±8.47*** |
| SBP (mm Hg) | 109.8±9.14 | 115.2±16.65 | 101.7±7.82 | 108.3±7.57 | 127.3±18.50 |
| DBP (mm Hg) | 64.8±11.27 | 76.7±16.55 | 59.5±9.30 | 63.9±7.02 | 89.5±18.91 *** |
| PP (mm Hg) | 44.9±7.12 | 38.5±3.88 * | 42.2±4.40 | 44.4±4.94 | 37.7±4.03 ** |
| MAP (mm Hg) | 81.4±9.72 | 90.8±16.17 | 74.8±8.72 | 80.2±6.94 | 103.3±18.77 *** |
| SV (ml/beat) | 80.9±16.30 | 55.9±12.32 *** | 76.4±13.32 | 80.1±11.12 | 46.9±11.65 *** |
| CO (L/min) | 4.8±0.80 | 4.5±0.96 | 4.7±0.84 | 4.9±0.61 | 3.9±1.00 |
| PR (MU) | 1.12±0.41 | 1.34±0.65 | 1.1±0.51 | 1.0±0.19 | 1.87±0.91 |
| AI (MU) | 48.5±14.20 | 52.9±1.77 | 53.5±4.12 | 53.7±2.68 | 57.5±3.57 ** |
| AC (mMU) | 2.53±0.23 | 2.35±0.29 | 2.6±0.20 | 2.5±0.22 | 1.87±0.37 *** |
**/ *** Significantly different from baseline at p<0.01 and p<0.001 respectively
The CVS response to orthostatic stress before and after HDBR in the RT group have been shown in Table 3. HR, DBP and MAP increased significantly during HUTT from baseline. SBP increased during HUTT after HDBR only. A significant reduction in SV and CO was observed during orthostatic stress. AC reduced significantly during HUTT before HDBR (P<0.01) and after HDBR (P<0.001).
| Parameters | BL | HUTT before HDBR | Early HDBR | Late HDBR | HUTT after HDBR |
|---|---|---|---|---|---|
| HR (bpm) | 64.8±7.36 | 78.1±11.00 *** | 65.0±7.40 | 64.9±6.89 | 77.9±10.81 *** |
| SBP (mm Hg) | 116.7±9.20 | 135.3±19.04 | 122.0±8.27 | 126.9±7.99 | 159.2±32.87 *** |
| DBP (mm Hg) | 68.2±7.72 | 88.2±16.49 *** | 71.3±5.75 | 74.8±7.61 | 106.5±14.29 *** |
| PP (mm Hg) | 47.1±7.76 | 47.1±5.84 | 50.7±3.07 | 52.1±1.78 | 44.3±4.69 |
| MAP (mm Hg) | 85.2±7.97 | 104.9±16.82 *** | 89.5±7.43 | 93.5±7.43 | 121.7±13.45 *** |
| SV (ml/beat) | 88.9±19.54 | 64.2±14.60 *** | 96.5±11.64 | 93.5±13.98 | 48.7±14.18 *** |
| CO (L/min) | 5.7±1.34 | 4.8±1.14 | 6.3±1.01 | 6.1±1.33 | 3.8±1.17 *** |
| PR (MU) | 1.1±0.42 | 1.5±0.54 | 1.2±0.72 | 1.1±0.29 | 2.3±0.92 |
| AI (MU) | 46.9±3.39 | 48.6±5.70 | 47.7±2.37 | 48.3±2.32 | 51.3±7.46 |
| AC (mMU) | 2.50±0.56 | 2.01±0.52 ** | 2.7±0.21 | 2.6±0.32 | 1.7±0.45 *** |
**/ *** Significantly different from baseline at p<0.01 and p<0.001 respectively
Percentage increase in HR during orthostatic stress was much higher in the ET group before and after HDBR (34 and 39% respectively) as compared to the RT group (20.4 and 20.2%) (Table 3 and Table 4). SBP, DBP and MAP response to orthostatic stress were higher in the RT group than the ET group during orthostatic stress. The RT group could maintain a higher absolute SV during orthostatic stress, but percentage decline in the parameter was higher in the RT group (42% vs 45% during post-HDBR HUTT). The RT group had a higher CO value (5.7±1.34 L/min) than the ET group (4.8±0.80 L/min) at baseline, but the RT group showed a higher fall during orthostatic stress after HDBR (18.7% in the ET group vs. 33.3% in the RT group). The AI fell during orthostatic stress in the ET and the RT group by 9% and 3.6% before HDBR and by 18.5% vs. 9.3 % after HDBR. The AC fell by a higher magnitude in the RT group than in the ET group (18% vs. 7.4%) before HDBR and after HDBR (30% vs. 26.2%).
| ET Group | RT Group | |||
|---|---|---|---|---|
| Absolute changes between Pre-HDBR HUTT and baseline | Percentage change | Absolute changes between Pre-HDBR HUTT and Baseline | Percentage change | |
| HR (bpm) | 20.7 | 34.0 | 13.3 | 20.40 |
| SBP (mm Hg) | 5.4 | 4.89 | 18.7 | 16.00 |
| DBP (mm Hg) | 11.9 | 18.20 | 20.1 | 29.42 |
| PP (mm Hg) | -6.4 | -14.29 | 0 | 0 |
| MAP (mm Hg) | 9.4 | 11.64 | 19.7 | 23.1 |
| SV (ml/beat) | -25 | -30.85 | -24.7 | -27.8 |
| CO (L/min) | -0.3 | -6.05 | -0.9 | -18.7 |
| PR (MU) | 0.22 | 19.11 | 0.4 | 36.01 |
| AI (MU) | 4.36 | 8.98 | 1.7 | 3.64 |
| AC (mMU) | -0.19 | -7.36 | -0.44 | -18.04 |
| ET Group | RT Group | |||
|---|---|---|---|---|
| Absolute changes between Post-HDBR HUTT and baseline | Percentage change | Absolute changes between Post-HDBR HUTT and Baseline | Percentage change | |
| HR (bpm) | 23.6 | 38.90 | 13.1 | 20.16 |
| SBP (mm Hg) | 17.5 | 15.92 | 42.50 | 36.44 |
| DBP (mm Hg) | 24.7 | 38.04 | 38.30 | 56.19 |
| PP (mm Hg) | -7.2 | -16.03 | -2.73 | -5.81 |
| MAP (mm Hg) | 21.9 | 26.94 | 36.55 | 42.91 |
| SV (ml/beat) | -34.0 | -42.1 | -40.25 | -45.26 |
| CO (L/min) | -0.9 | -15.78 | -1.90 | -33.3 |
| PR (MU) | 0.75 | 66.19 | 1.21 | 113.44 |
| AI (MU) | 9.0 | 18.51 | 4.35 | 9.26 |
| AC (mMU) | -0.66 | -26.19 | -0.72 | -29.66 |
BRS during orthostatic stress in the ET and the RT group is shown in Fig 1. BRS reduced significantly during HUTT before HDBR in both the ET (from 28.3±14.94 to 10.4±1.84 ms/mm Hg) (P<0.001) and the RT group (from 28.8±13.43 to 12.1±5.69 ms/ mm Hg) (P<0.001). After HDBR, BRS reduced further in the ET group to 9.5±2.51ms/mm Hg, but the same was not evident in the RT group, where a non-significant rise in BRS to 13.3±8.82 ms/mm Hg was observed.
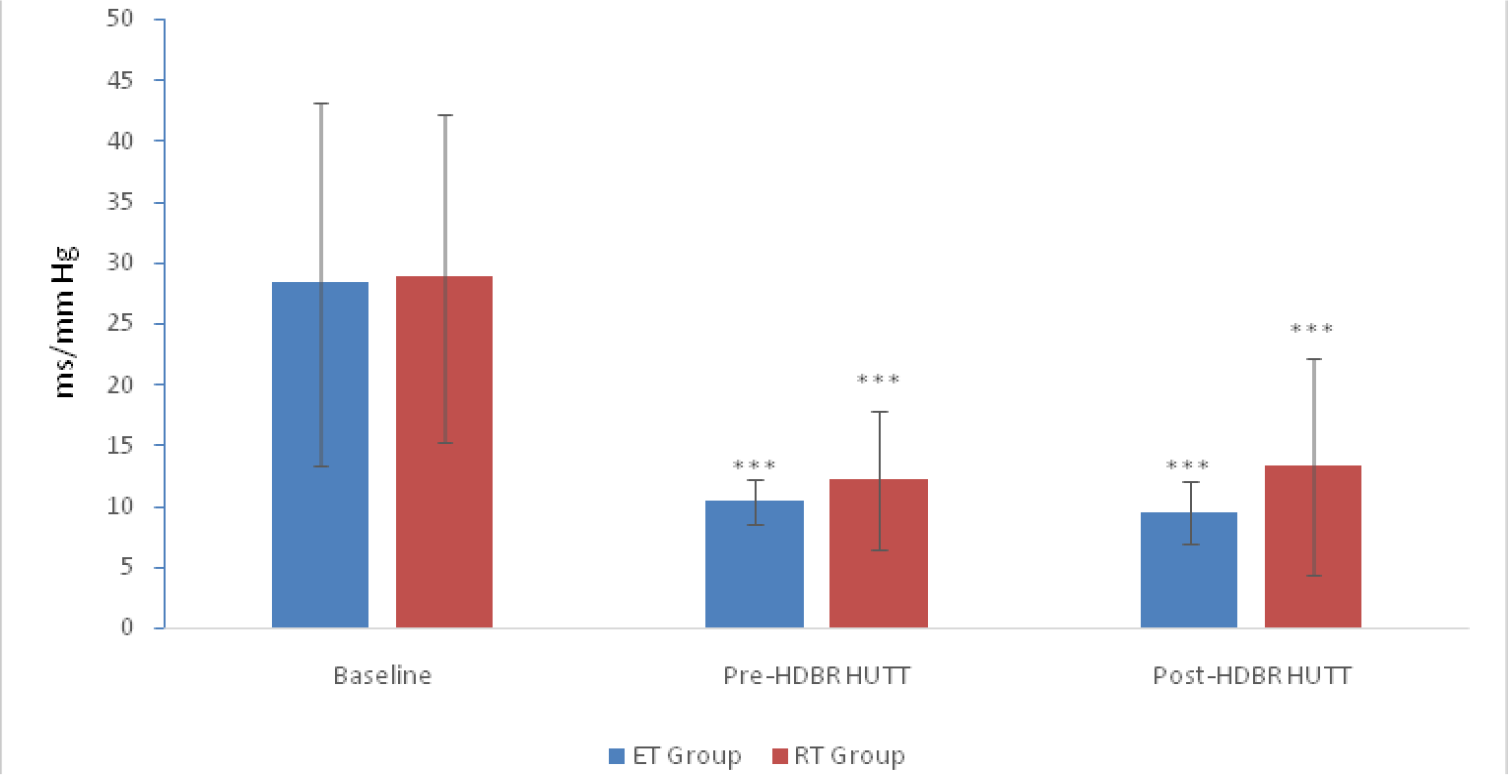
- Baroreflex Sensitivity (ms/mm Hg) in the ET and RT groups at baseline and during orthostatic stress before and after HDBR. Values are given as Mean ± SD.
- *** p <0.001, significantly different from baseline ET: Endurance Trained Group; RT: Resistance Trained.
Fig 2 shows the relationship between five cardinal parameters of cardiovascular system. These were SBP, PP, MAP, AI and AC. The peripheral resistance and arterial compliance were found to follow an inverse relationship. As peripheral resistance increased, MAP was found to rise and arterial compliance was found to dip. Comparatively, the RT group had a higher PR during orthostatic stress.
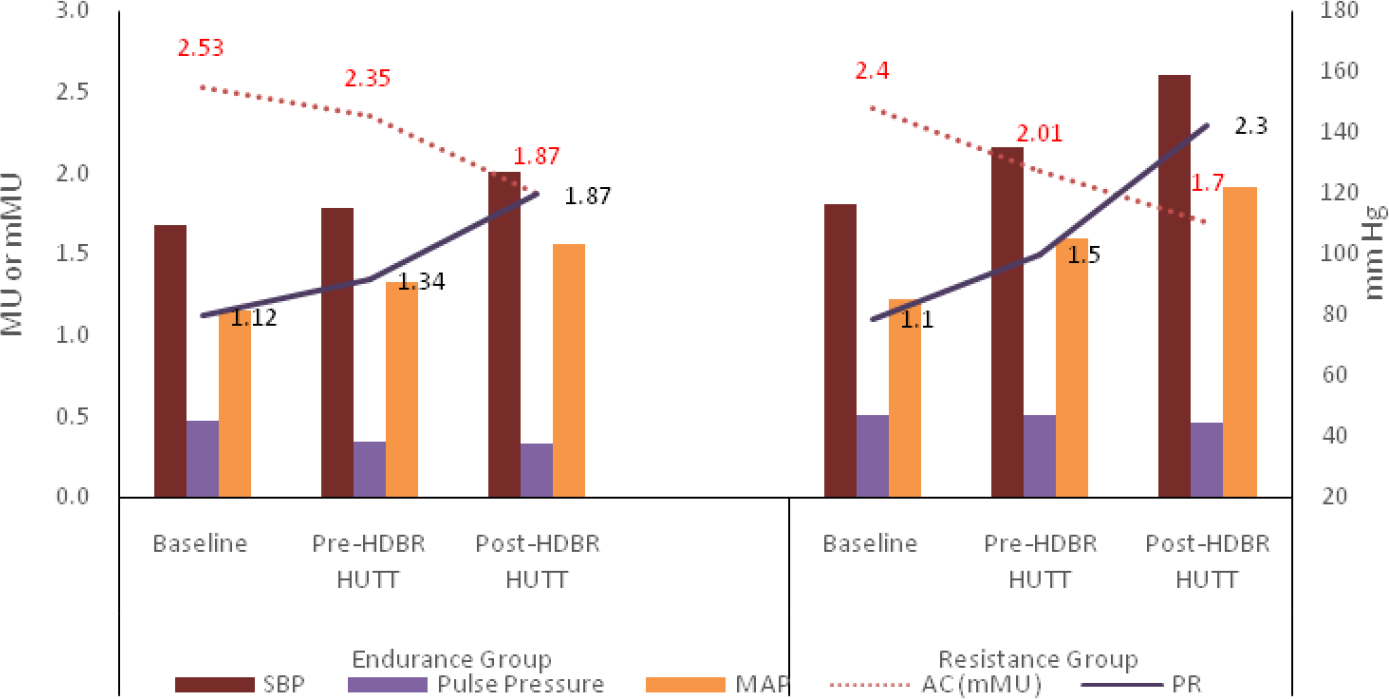
- Relationship between SBP. PP, MAP and Arterial Compliance (AC) & Peripheral Resistance (PR). [The numbers in red are AC and numbers in black are PR. The vertical axis on the right side is shown as blood pressure in mm Hg and on the left side is either PR in Medical Unit (MU) or AC in Milli Medical Unit (mMU).] 1
DISCUSSION
The study examined the CVS responses to orthostatic stress in endurance and resistance trained individuals following 6 hours of HDBR. The heart rate was observed to increase significantly during orthostatic stress in both the groups. The increase was more pronounced in ET group than RT group and more evident after HDBR. HDBR causes a cephalic shift of fluid from lower limb. The absence of hydrostatic gradient and tilting of head at -6° from the horizontal position facilitate transfer of fluid towards head side. The body gets adapted to new dynamics of fluid distribution under HDBR condition. Cardiovascular system and other body systems get adapted accordingly. Cardiovascular system when challenged by an orthostatic stress, after simulated microgravity, it responds differently in ET and RT individuals.
The physiological adaptations that occur with prolonged endurance training vary greatly with the adaptations associated with resistance training. Lower limb vasculature becomes more compliant in endurance training. Therefore, a large quantity of blood is pooled towards lower limb, which may lead to a large decrease in central blood volume. Unlike endurance training, resistance trained athletes build up their lower limb and upper limb muscles through weight training. The strong muscular tone in lower limbs of RT individuals prevents the central hypovolemia occurring during exposure to orthostatic stress. Prolonged endurance training is also reported to be associated with development of a steeper left cardiac pressure-stroke volume slope [12]. The steeper slope confers some advantages to the endurance trained athletes by deriving a greater cardiac output during exercise but this puts them in disadvantageous position during orthostatic stress. Orthostatic stress causes a reduction in enddiastolic filling of the left ventricle, which may lead to a 20% reduction in stroke volume and cardiac output [13]. Reduced cardiac filling pressure, stroke volume as well as inadequate neurohumoral reflex responses to orthostatic stress have been reported to contribute orthostatic intolerance in endurance trained athletes [14]. Significant reduction in stroke volume occurred in both the groups during orthostatic stress, and becomes more apparent after HDBR. RT group maintained a non-significantly higher value of SV and CO during orthostatic stress. However, it is interesting to note that the RT individuals had a greater percentage fall in stroke volume and cardiac output when compared with endurance trained ET individuals. A higher initial value of SV and CO in them might have been the reason for this.
Aortic impedance, a measure of ventricular afterload, is calculated by dividing aortic pressure by aortic flow [15]. A comparatively higher aortic impedance in the ET group during orthostatic stress might be the reason for achieving a lower SV when compared with their RT counterparts. Pulse pressure was found to be higher during orthostatic stress in the RT group. The arterial compliance and pulse pressure are indirectly related to each other [16]. Since the arterial compliance was found to be higher in RT group, higher pulse pressure (PP) is therefore an expected finding in this group.
The total peripheral resistance (PR) is the resistance offered to the flow of the blood by the systemic arterial tree and is determined by the tone of the sympathetic neural activity. The slightly higher PR in the RT group might have helped achieving a higher SV and CO during orthostatic stress. Higher PR in the RT group corroborates with achievement of higher DBP in the RT group.
Pooling of blood in lower limb vessels during orthostasis lead to activation of sympathetic neural system which makes the ventricle hypercontractile [17]. The higher cardiac frequency may lead to possible activation of left ventricular mechanoreceptor, which initiates vagal stimulation and sympathetic withdrawal. Comparatively, a higher heart rate in ET individuals during postural stress is suggestive of higher sympathetic neural activation.
Higher sympathetic neural activity during postural stress has also been examined by analysing the heart rate variability (HRV) indices by another study [7]. The study suggested that the ratio of low frequency to high frequency waves (LF/HF ratio), which is an indicator of sympatho-vagal neural activity was significantly higher during post-HDBR orthostasis in the ET group. This is an indication of higher sympathetic neural drive. LF/HF ratio was found to be attenuated in the RT group.
The BRS measures the responsiveness of the baroreceptors to prevent any blood pressure changes. This reflex is the most important nervous regulatory mechanism of blood pressure homeostasis and has been used to assess the efficacy of the autonomic cardiovascular function. The resting value of BRS has been reported to be in the range of 9-10 ms/mm Hg [18-19]. A value lower than this represents a sympathetic augmentation and indicates a more responsive baroreceptor reflex and a higher value represents a sluggish baroreflex responsiveness and is indicative of sympathetic attenuation. The BRS was found to be reduced during orthostatic stress and becomes more pronounced in the ET group. A decreased BRS value in the ET group during orthostatic stress is perhaps an indication of heightened sympathetic activity. The slightly higher BRS value in the RT group indicates an attenuation of sympathetic neural drive and possibly a higher parasympathetic neural drive.
CONCLUSION
The study highlighted the differences in cardiovascular response to orthostatic stress following 6 hr of HDBR in ET and RT individuals. Though no participant had frank syncope during orthostatic stress, the ET individuals demonstrated a higher heart rate, lower baroreceptor responsiveness and lower arterial compliance in comparison to their RT counterparts. The responses were found to be more pronounced after 6 hours HDBR. In contrast, the RT individuals, showed an attenuated heart rate, increased aortic impedance and increased arterial compliance. They could maintain a higher systolic, diastolic, pulse and mean arterial blood pressure during orthostatic stress and this trend was maintained even after 6 hours HDBR. This might confer that RT individuals a better orthostatic tolerance ability in comparison to the ET individuals especially in a simulated microgravity condition (6 hr HDBR). However, a robust study in future would be necessary to understand the detailed mechanism of orthostatic intolerance in differently trained individuals and its possible implications for future manned space flight, specifically while selecting the astronauts.
Acknowledgement
The author is thankful to the participants from the Indian Army Unit and also, to JWO Paritosh Mishra and Cpl Subhash, the Medical Assistants of the Department of Space and Environment Physiology for their sincere contribution towards smooth conduct of the study. Author is also thankful to the Commandant, Dy Commandant and Oi/C Sports of MEG and Centre, Bangalore for their valuable administrative support.
Conflict of Interest
Nil
References
- Regulation of central blood volume and cardiac filling in endurance athletes: The Frank-Starling mechanism as a determinant of orthostatic tolerance. Med Sci Sports Exerc. 1993;25(6):727-32.
- [Google Scholar]
- Reduction in LBNP tolerance following prolonged endurance exercise training. Med Sci Sports Exerc. 1992;24(11):1235-44.
- [Google Scholar]
- Effect of longitudinal physical training and water immersion on orthostatic tolerance in men. Aviat Space Environ Med. 1988;59(2):152-9.
- [Google Scholar]
- Resistance exercise training and the orthostatic response. Eur J Appl Physiol Occup Physiol. 1997;76(1):32-40.
- [Google Scholar]
- Cardiovascular responses to lower body negative pressure in endurance and static exercise-trained man. Med Sc Sport Exerc. 1986;18(5):545-50.
- [Google Scholar]
- Sympatho-vagal Modulation of Cardiovascular Functions of Aerobic and Resistance Trained Individuals in Simulated Microgravity. Indian J Aerospace Med. 2014;58(2):1-7.
- [Google Scholar]
- Circadian blood pressure and systemic haemodynamics during 42 days of 6 degrees head-down tilt. Acta Physiol Scand. 1997;161:71-80.
- [Google Scholar]
- Comparison of finger and intra-arterial blood pressure monitoring at rest and during laboratory testing. Hypertension. 1989;13:647-55.
- [Google Scholar]
- Noninvasive blood pressure pulse detection and blood pressure determination. PhD thesis, Faculty of Technology, Department of Electrical and Information engineering, Infotech Oulu, University of Oulu.
- [Google Scholar]
- Computation of aortic flow from pressure in humans using a nonlinear, three-element model. J Appl Physiol. 1993;74:2566-73.
- [Google Scholar]
- Graded vascular autonomic control versus discontinuous cardiac control during gradual upright tilt. J Auton Nerv Syst. 2000;79:149-55.
- [Google Scholar]
- Carotid baroreflex responsiveness to head-up tilt induced central hypovolemia: Effect of aerobic fitness. J Physiol. 2003;551(2):601-8.
- [Google Scholar]
- Continuous stroke volume monitoring by modelling flow from non-invasive measurement of arterial pressure in humans under orthostatic stress. Clin Sci. 1999;97(3):291-301.
- [Google Scholar]
- Orthostatic hypotension. In: Parmley WW, Chatterjee K, eds. Cardiology. Vol 1. Philadelphia (USA): Lippincott; 1990. p. :1-20.
- [Google Scholar]
- Blood pressure and peripheral circulation In: Opie LH, ed. Heart Physiology: From Cell to Circulation (4th ed). Philadelphia (USA): Lippincott Williams & Wilkins; 2004. p. :431-59.
- [Google Scholar]
- Properties of the Vasculature In: Koeppen BM, Stanton BA, eds. Berne & Levy Physiology (7th ed). Philadelphia (USA): Elsevier; 2018. p. :345-85.
- [Google Scholar]
- Left Ventricular Hypercontractility Immediately after Tilting Triggers a Disregulated Cardioinhibitory Reaction in Vasovagal Syncope: Echocardiographic Evaluation during the Head-Up Tilt Test. Cardiology. 2010;117:118-23.
- [Google Scholar]
- Sex Difference in the Effect of Whole Body Heating on Cardiovascular Functions. Ind J physiol Pharmacol. 2015;59(2):136-47.
- [Google Scholar]
- Blood pressure variability and baroreflex sensitivity of a healthy male during cold pressor test that induced development of neurocardiogenic syncope. J Basic Clin Physiol Pharmacol. 2016;27(4):437-43.
- [Google Scholar]


