
Translate this page into:
Anthropometric changes in male subjects on exposure to 24 hours of simulated microgravity

*Corresponding author: Manu Ningaiah, Department of Aerospace Medicine, Institute of Aerospace Medicine, Bengaluru, Karnataka, India. dr.manu.n@gmail.com
-
Received: ,
Accepted: ,
How to cite this article: Ningaiah M, Agarwal A, Malhotra VK, Rao NA. Anthropometric changes in male subjects on exposure to 24 hours of simulated microgravity. Indian J Aerosp Med 2024;68:36-41. doi: 10.25259/IJASM_13_2024
Abstract
Objectives
Condition of weightlessness remains one of the primary environmental concerns of space flight. A variety of ground-based studies using analogs of weightlessness have been carried out to investigate the effects of weightlessness on the human body. Significant data are available on anthropometric changes that occur on exposure to microgravity. However, there has been scanty data on the anthropometric changes that occur after 24 h of exposure to microgravity. This study was designed to assess the changes in anthropometric parameters of human male subjects on exposure to 24 h of microgravity using dry supine immersion (DSI) which is one of the ground-based simulators of microgravity.
Material and Methods
A total of 10 volunteer subjects were exposed to 24 h of microgravity that was simulated by DSI. Anthropometric parameters such as weight, supine body length, body mass index (BMI), leg girth, and calf girth were measured pre and post-exposure to simulated microgravity. The results were collated and analyzed using a paired student t-test.
Results
The results showed a statistically significant increase in the supine body length (effect size = 0.096, P = 0.009). The study also showed a statistically significant decrease in the weight (effect size = −0.07, P = 0.0001), BMI (effect size = −0.15, P = 0.0006), calf girth (effect size = −0.59, P = 0.0001), and thigh girth (effect size = −0.33, P = 0.016).
Conclusion
A significant increase in supine body length by a mean value of 0.67 cm was noted after 24 h of exposure to simulated microgravity. A significant reduction in weight, calf girth, and thigh girth by 880 g, 1.33 cm, and 1.18 cm was noted after 24 h of exposure to simulated microgravity.
Keywords
Calf girth
Dry supine immersion
Microgravity
Supine body length
Thigh girth

INTRODUCTION
Out of the various stressors experienced in space flights, weightlessness remains one of the primary environmental concerns. Exposure to microgravity has been attributed to cause various physiological responses. Conclusion of the Gemini program in 1966 showed an association of reduction in red cell mass, loss of body calcium, diminished exercise capacity post-flight, and orthostatic intolerance post-flight with man-hours exposure to microgravity exceeding 2000 h.[1]
As conducting all studies of physiological response in space was not feasible economically, variety of ground-based simulation studies using analogs of weightlessness have been carried out. Significant data are available on anthropometric changes that occur on exposure to microgravity for the duration of space travel. However, there has been scanty data on the anthropometric changes that occur after 24 h of exposure to microgravity. This study was designed to assess the changes in anthropometric parameters of human male subjects after 24 h of exposure to dry supine immersion (DSI) which is one of the ground-based simulators of microgravity.
Aim and objective
The study was designed to compare and analyze the anthropometric changes before and after exposure to 24 h of simulated microgravity.
MATERIAL AND METHODS
The research was conducted in the Department of Space and Environmental Physiology in the Institute of Aerospace Medicine, Bengaluru, India. 10 healthy male volunteer participants were part of the research. All participants were healthy and free of any kind of pathologies. All participants were briefed about the protocol and oriented to DSI chamber and a written informed consent was obtained from each participant. The protocol was cleared by the Institutional Ethical Committee in Institute of Aerospace Medicine.
Equipment used
-
DSI tank. The laboratory had two DSI tanks, with each tank having the capacity to hold 1000 L of water on which the subjects were made to float. A thin sheet of plastic would separate subjects from water in the tank [Figure 1a]. The whole system contained solar tanks, cold water tanks, external storage tank, internal test tank, boiler, and multiple electrical control valves. The test tank would receive preheated water which was continuously circulated between the external storage tank and test tank to ensure an isothermal water temperature of 34 ± 0.5°C. The heating of water was achieved by solar heaters and a tube-type heat exchanger which used steam from a boiler running in tubes inside the collecting tank which ensured safety and avoided electrical interference while collecting data using electromedical equipments. The temperature was regulated using a central control unit [Figure 1b].
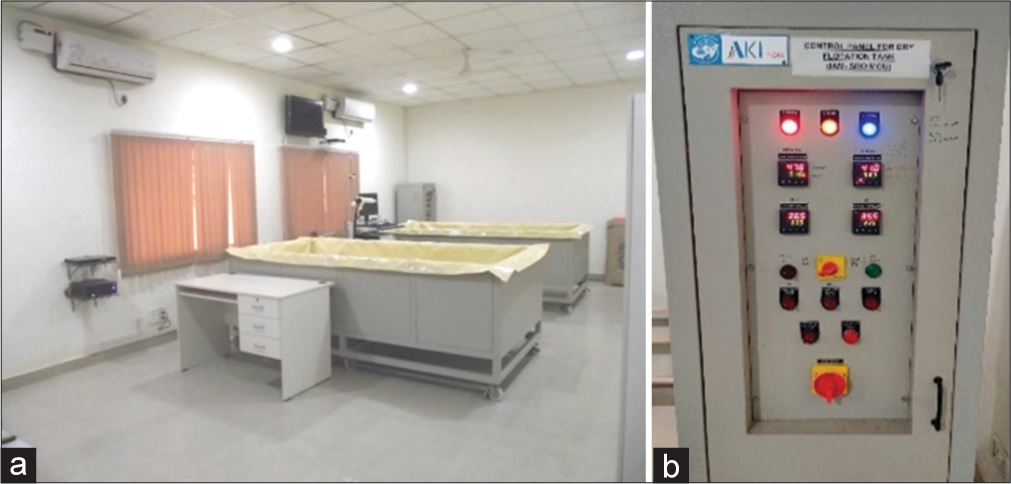 Figure 1:
- (a and b) Dry supine immersion tanks with control unit.
Weighing scale, Measuring tape, and hard bed.
Resting values of four anthropometric parameters, namely supine body length, weight, calf circumference, and thigh circumference were measured.
-
The authors measured these parameters as they could be measured fast after termination of exposure to microgravity.
Body length: The subject was made to lie supine on a head-down tilt table in 0° tilt with feet affixed on the footplate. The heel-to-vertex length was measured.
Weight: It was measured using an ActiveX Savvy weight scale which measures to the lowest value of 10 g.
-
Calf girth was measured at the maximum level of calf to the lowest value of 1 mm. The location of measurement was marked with a pen along the length of the tape for reference [Figure 2].
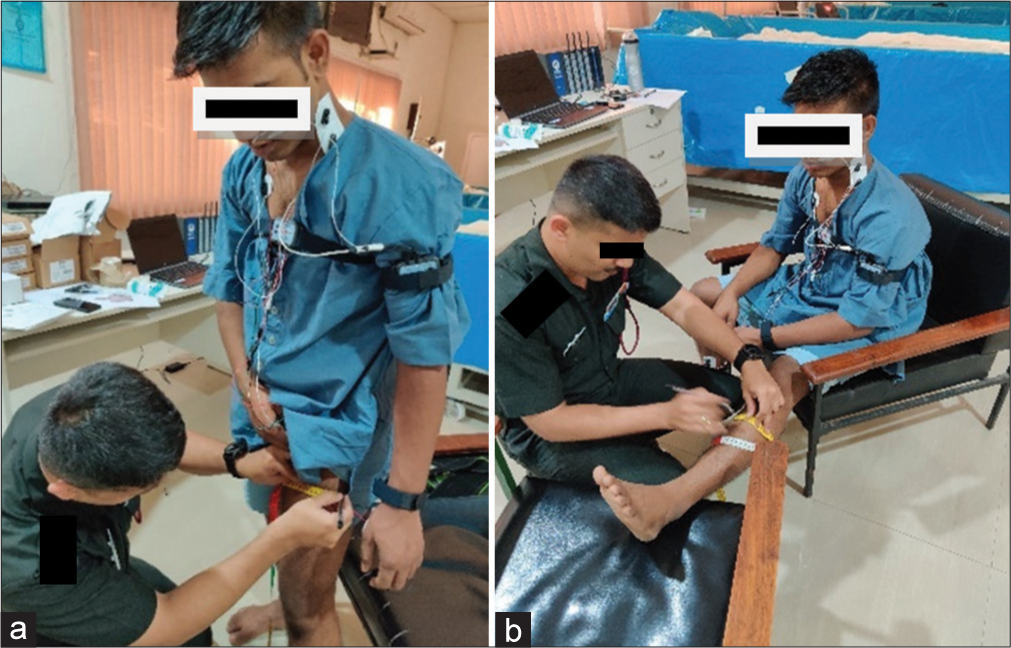 Figure 2:
- (a) Measuring of thigh girth and (b) calf girth.
Thigh girth was measured at the maximum level of thigh to the lowest value of 1 mm. The location of measurement was marked with a pen along the length of the tape for reference [Figure 2].
The participants were shifted to the DSI tank and were provided with standardized meals. A standard menu was designed and was sourced from the same caterer. There was no restriction on water intake for each of the subjects.
The anthropometric parameters were repeated after 24 h of exposure to microgravity.
The data were collated and a paired student t-test was applied for the pre and post-values with an alpha of <0.05.
RESULTS
Ten healthy male volunteer participants were part of the research with a mean age of 27.1 ± 4.7 years. The mean weight was 67.635 ± 11.25 kg, mean height 171.97 ± 7.25 cm, and body mass index (BMI) 22.84 ± 3.23 kg/m2.
Weight
The mean weight of the 10 subjects was 67.635 ± 11.29 kg before exposure to DSI and was 66.757 ± 11.53 kg post 24 h of exposure to DSI. The weight of subjects reduced significantly compared to pre-exposure values. The effect size was −0.07 and P-value was 0.0001 (<0.05). The pre- and post-values and comparison of means are shown in Figure 3.
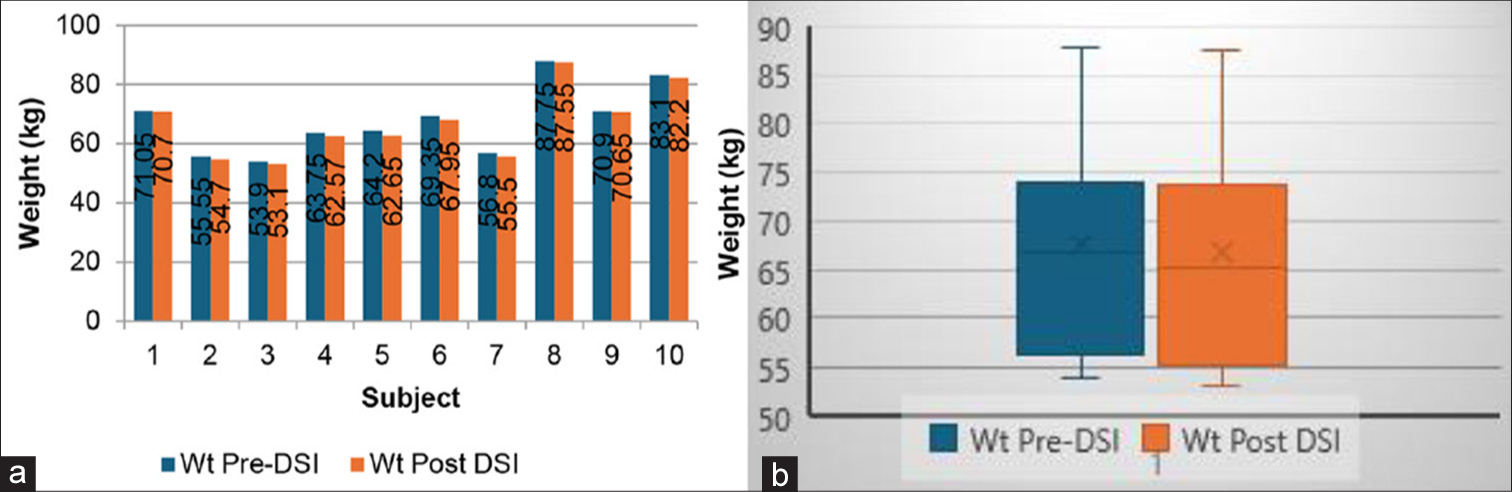
- Weight: (a) pre and post exposure to DSI, (b) comparison of means. DSI: Dry supine immersion.
Height
The mean height of the 10 subjects was 171.97 ± 7.25 cm before exposure to DSI and was 172.64 ± 7.05 cm post 24 h of exposure to DSI. The height of subjects has significantly increased compared to pre-exposure. The effect size was 0.096 with a P-value of 0.009 (<0.05). The pre- and post-values and comparison of means are shown in Figure 4.
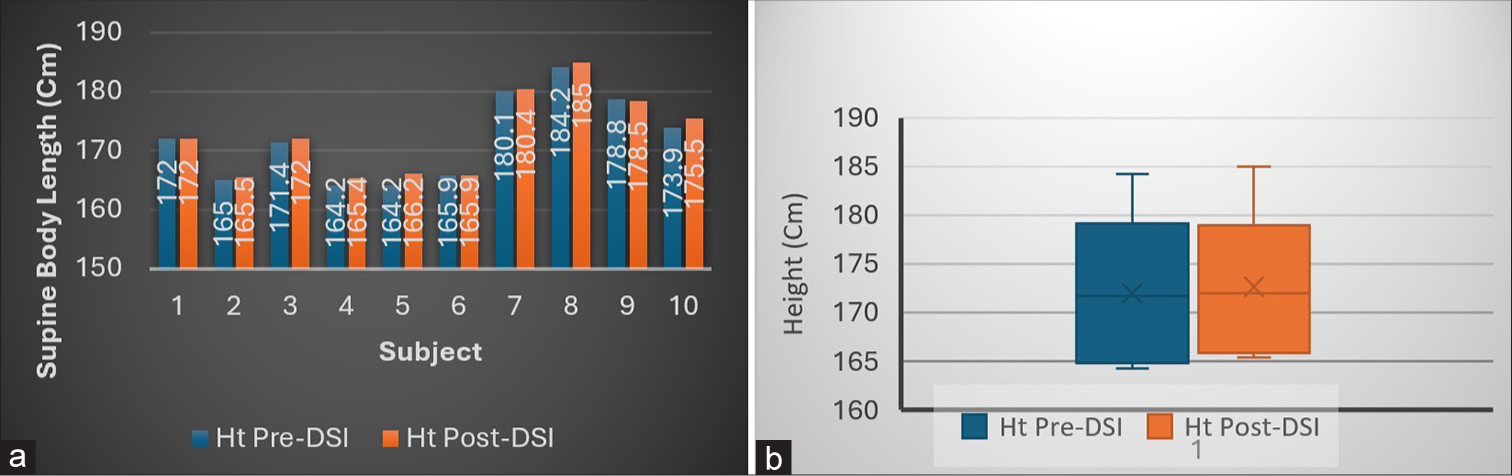
- Height: (a) pre and post exposure to DSI, (b) comparison of means. DSI: Dry supine immersion.
BMI
The mean BMI of the 10 subjects was 22.85 ± 3.23 kg/m2 before exposure to DSI and was 22.36 ± 10.06 kg/m2 post 24 h of exposure to DSI. The BMI has significantly decreased compared to pre-exposure. The effect size was −0.15 with a P-value of 0.0006 (<0.05). The pre and post-values and comparison of means are shown in Figure 5.

- Body mass index (BMI): (a) pre and post exposure to DSI, (b) comparison of means. DSI: Dry supine immersion.
Calf girth
The mean calf girth of the 10 subjects was 34.8 ± 2.31 cm before exposure to DSI and was 33.47 ± 2.11 cm post 24 h of exposure to DSI. The calf girth has significantly reduced compared to pre-exposure values. The effect size was −0.59 with a P-value of 0.0001 (<0.05, d = −0.59). The pre and post-values and comparison of means are shown in Figure 6.

- Calf girth: (a) pre and post exposure to DSI, (b) comparison of means. DSI: Dry supine immersion.
Thigh girth
The mean thigh girth of the 10 subjects was 50.73 ± 3.55 cm before exposure to DSI and was 49.55 ± 3.76 cm post 24 h of exposure to DSI. The thigh girth has significantly reduced compared to pre-exposure values. The effect size was −0.33 with a P-value of 0.016 (<0.05). The pre and post-values and comparison of means are shown in Figure 7.
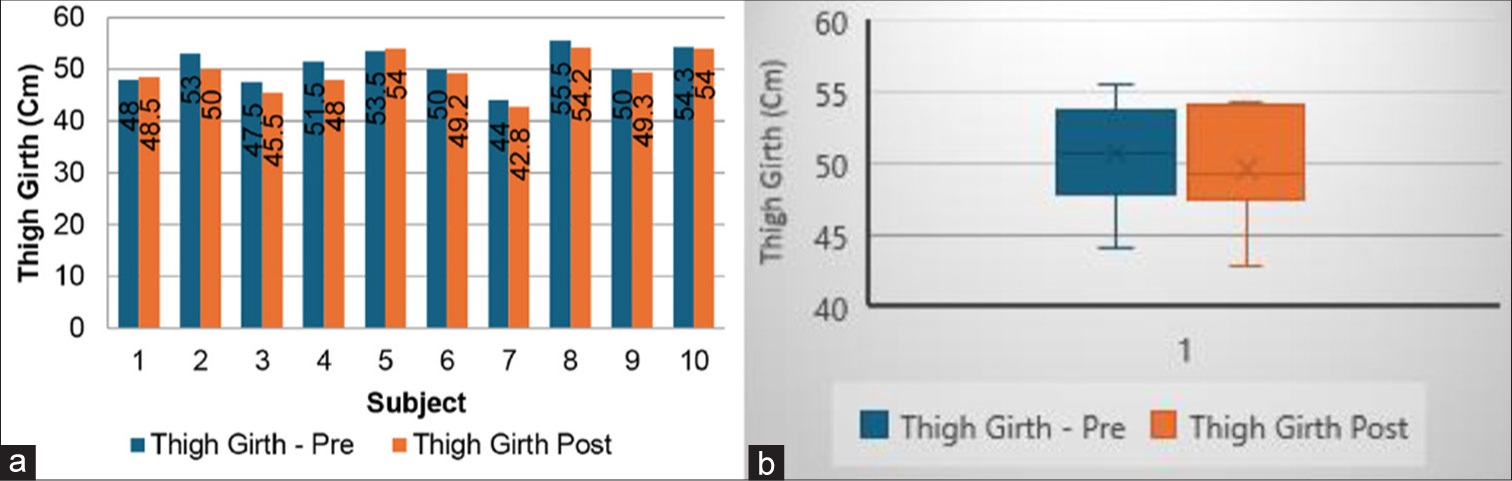
- Thigh girth: (a) pre and post exposure to DSI, (b) comparison of means. DSI: Dry supine immersion.
DISCUSSION
Ten volunteers participated in this study. Each volunteer was subjected to 24 h of simulated microgravity. The simulation of microgravity was achieved using DSI. Statistical analysis showed a statistically significant reduction in weight, calf girth, and thigh girth and a statistically significant increase in the height of volunteers.
The Earth’s gravitational field is an ever-present force, and the various physiological functions of the human body are based on it. As humans venture into space, the weightlessness of space results in various physiological changes that vary depending on the duration of flight. Despite numerous human spaceflights in the past 60 years, the physiological and anthropometric changes are still not fully understood. The effects of microgravity on human body in short duration are under study as its understanding plays a crucial role in space tourism which is shaping up in a significant manner in today’s aerospace environment. A few physiological changes that have been documented have been described below.
Gravity pulls blood downward from the central circulation in upright humans. Thus, in the absence of gravity central fluid redistribution is noted, this redistribution triggers the Henry–Gauer reflex and other related reflexes.[2] The cephalad fluid shift causes distention of the heart muscles and in turn stimulates the baroreceptors, leading to reduction in sympathetic nerve activity, reduction of antidiuretic hormone secretion, reduced renin–angiotensin–aldosterone system activity, and an increase in atrial natriuretic peptide secretion. Natriuresis and diuresis are elicited due to these neurohumoral responses. The reduced blood volume as a result of the neurohumoral response causes a central circulatory homeostasis appropriate for existence in microgravity.
In the present study, significant changes in anthropometric parameters such as supine body length, weight, and BMI were observed. A significant reduction in total body weight with an average reduction of 880 g was noted in the subject’s following exposure to simulated microgravity for 24 h. Buckey et al. in 1996 noted a weight loss of an average 1.1 kg in 14 subjects after 10–14 days of exposure to microgravity in spaceflights.[3] The findings in the present study may allow a new interpretation of the findings of Buckey et al. that nearly 80% of the weight loss that happens over a period of 10– 14 days happens in the initial 24 h.[3] Nutritional variations have been attributed as the cause for this weight loss by Buckey et al.[3] However, the current study indicates that not only does the majority of weight loss occur in the first 24 h but also it is more likely due to fluid loss as nutritional weight loss cannot be elicited as early as 24 h. Smith et al. in 2005 have also reported a 5% mean body weight loss for 11 astronauts aboard the ISS in missions extending between 128 and 195-day missions.[4] Although the weight loss in long-duration missions may be attributed to nutritional variations, as brought out earlier, this study puts a newer understanding to the causes in short duration.
There was a significant increase in the supine body length of subjects by a mean value of 0.67 cm after 24 h of exposure to simulated microgravity in this study which was in conformance with previous studies conducted in both simulated microgravity and actual space missions. Changes in height on exposure to weightlessness were first documented on Skylab Mission 4 and also on Apollo-Soyuz test projects. An increase in stature after 24 h of exposure to microgravity was noted in the Skylab mission 4, followed by a stature which remained steady at 4–6 cm greater than the original measurement.[5] Thornton et al. noted an increase in seated height on exposure to microgravity and attributed it to the expansion of intervertebral disks due to the unloading of the disk and also thoracolumbar curvature loss.[6] A bed rest study which also is a ground-based simulation of microgravity was conducted by Hutchinson et al. in 1995 by subjecting 8 subjects to a 6° head-down tilt for 16 days. An increase in stature by 2.1 ± 0.5 cm was noted by day 3 which remained unchanged and throughout the rest of the study duration.[7] It has also been documented that most of the increase in height occurs during the first 2 weeks and then stabilizes at approximately 3% above the pre-flight values in Man system integration standards brought out by NASA.[8] A 0.39% increase in height was noted above the pre-exposure value in the present study.
The BMI was significantly reduced by an average of 0.5 kg/m2. A significant reduction of body weight associated with a significant increase of supine body length has led to a significant change in BMI which is deduced out of the two variables.
The calf girth and thigh girth were reduced after 24 h of exposure to microgravity. The calf girth and the thigh girth both reduced significantly by an average value of 1.33 cm and 1.18 cm, respectively. The hydrostatic gradient in the venous vascular system is lost on exposure of humans to microgravity, resulting in a cephalad shift of about 1–2 L of fluid in the circulatory system which was noted in Skylab.[9,10] This amount is larger than the shifts when a human moves from an upright stance to a supine position or also to that noted in a head-down-tilt posture on Earth as noted by Thornton et al. in 1992.[11] This shift is thought to occur because of an intact counterpooling mechanism even after exposure to simulated microgravity. This phenomenon is caused by headward shift of venous volume. The volume sensors or baroreceptors in the axis of caudal shift (wall of the heart and blood vessels) sense it as volume overload causing increased redistribution and increased micturition thus reducing the fluid content in otherwise normal environment at 1 G. This causes a reduction in weight and leg girth which was observed in the present study as well.
The sample size of ten subjects in the study was low which was one of the limitations. Documentation of the fluid intake and urinary output in the study protocol would have provided a confirmatory evidence of fluid loss which was not conducted in the present research. The study also has limited to basic parameters such as supine body length, weight, and lower limb circumferences. A detailed anthropometric data essential for designing space suits can be envisaged in the future studies.
CONCLUSION
DSI is an effective method to simulate the effects of weightless. This study brought out the significant changes in anthropometric parameters on exposure to weightlessness. A significant increase in body length was noted within the first 24 h and a significant decrease in body weight, thigh girth, and calf girth was noted. This study could bring out that anatomical unloading of the body contributed significantly to causing these changes to contrast to the thought of lack of nutrition causing the decrease in body weight and leg girth. The confirmation of significant alterations in fundamental anthropometric parameters highlighted in this study underscores the need for further research to comprehensively evaluate essential anthropometric variables. Such studies are critical for the optimization of crew workspace and the design of space suits to accommodate measurement variations effectively.
Ethical approval
The research/study was approved by the Institutional Review Board at the Institute of Aerospace Medicine, number 001, dated 12th November, 2018.
Declaration of patient consent
The authors certify that they have obtained all appropriate patient consent.
Conflicts of interest
Anupam Agarwal is on the editorial board of the journal.
Use of artificial intelligence (AI)-assisted technology for manuscript preparation
The authors confirm that there was no use of artificial intelligence (AI)-assisted technology for assisting in the writing or editing of the manuscript and no images were manipulated using AI.
Financial support and sponsorship: Nil.
References
- Human response to space flight In: Principles of clinical medicine for space flight. Germany: Springer; 2019. p. :367-411.
- [CrossRef] [Google Scholar]
- The cardiovascular system in microgravity. Sec 4: Environmental physiology In: Handbook of physiology. United States: Wiley; 1996. p. :631-74.
- [CrossRef] [Google Scholar]
- Orthostatic intolerance after spaceflight. J Appl Physiol. 1996;81:7-18.
- [CrossRef] [PubMed] [Google Scholar]
- The nutritional status of astronauts is altered after long-term space flight aboard the International Space Station. J Nutr. 2005;135:437-43.
- [CrossRef] [PubMed] [Google Scholar]
- Height changes in microgravity. Results of the life sciences DSOs conducted aboard the space shuttle 1981-1986 United States: National Aeronautics and Space Administration; 1987. p. :55-7.
- [Google Scholar]
- Anthropometric changes and fluid shifts In: Proceeding of the skylab life sciences symposium. Vol 2. 1974.
- [Google Scholar]
- Back pain during 6 degrees head-down tilt approximates that during actual microgravity. Aviat Space Environ Med. 1995;66:256-9.
- [Google Scholar]
- Antrhopometry and biomechanics. Man-system integration standards In: NASA-STD-3000. Vol 3. United States: National Aeronautics and Space Administration; 1989. p. :56-7.
- [Google Scholar]
- Cardiovascular adjustments to gravitational stress In: Shepard JT, Abboud FM, eds. Handbook of physiology, section 2 (The cardiovascular system). Vol 3. Bethesda, MD: American Physiological Society; 1983. p. :1025-63.
- [CrossRef] [Google Scholar]
- Anthropometric changes and fluid shifts In: Johnston RS, Dietlein LF, eds. Biomedical results from Skylab. NASA SP-377. Washington, DC: US Government Printing Office; 1977. p. :330-8.
- [Google Scholar]
- Changes in leg volume during microgravity simulation. Aviat Space Environ Med. 1992;63:789-94.
- [Google Scholar]


