Translate this page into:
An analysis of transcranial doppler to interpret changes in cerebral circulation under +Gz

*Corresponding author: Dr. S Dinakar, MBBS, MD, Department of Acceleration Physiology and Spatial Orientation, Institute of Aerospace Medicine IAF, HAL Old Airport Road, Vimanapura Post, Bengaluru - 560 017, Karnataka, India. dinakarsneha@gmail.com
-
Received: ,
Accepted: ,
How to cite this article: Dinakar S, Agarwal A. An analysis of transcranial doppler to interpret changes in cerebral circulation under +Gz. Indian J Aerosp Med 2019;63(2):61-4.
Abstract
Introduction:
The use of Transcranial Doppler (TCD) to measure the cerebral blood flow velocity (BFV) is one of the most elusive tasks under +Gz. The reason for this is the technical difficulty in keeping the TCD fixed during acceleration. There is no conclusive principle of the behavior of cerebral blood vessels under +Gz, despite earlier attempts in animal/human studies. In our study, we were able to overcome the technical difficulty and record the cerebral BFV of the middle cerebral artery under +Gz.
Material and Methods:
Twenty healthy adult males consented to participate in the study. High-performance human centrifuge was used to subject them to +Gz acceleration. The participants were instrumented with electrocardiography, thermistor bead, oxygen saturation probe, non-invasive blood pressure and TCD probe. Relaxed peripheral light loss (PLL) and straining PLL were recorded in a single gradual-onset rate profile.
Results:
The TCD data were retrieved and the data was plotted. The Doppler waveform varied with a change in +Gz. Pulsatility (Gosling) index was derived. The index increases as Gz level builds up, indicating an increase in arterial resistance. This increase was statistically significant.
Conclusion:
The understanding, so far, has been based on a presumption of vasoconstriction in the cerebral arteries. However, when monitoring TCD against increasing +Gz, it is not the presence or absence of the waveform that is of significance; however, it is the change in the pattern of the waveform that is noteworthy.
Keywords
Transcranial Doppler
Blood flow velocity
+Gz
Cerebral blood flow
Middle cerebral artery
High-performance human centrifuge
Peripheral light loss
Non-invasive blood pressure
INTRODUCTION
The circulatory effects of +Gz have been explained on the basis of the hydrostatic pressure model.[1-3] However, some circulatory effects of +Gz are not explainable by this simplistic model. These effects are explained hypothetically on the basis of the effect of baroreceptors and autoregulation of cerebral circulation. Unfortunately, as the skull is a closed compartment, there is no way of measuring these changes.[4] Transcranial Doppler (TCD) studies can measure blood flow velocity (BFV) in the cerebral circulation.[5] However, displacement of the TCD probe under +Gz has prevented effective use of this device for the assessment of cerebral blood flow.[6,7] A new method for fixing of the TCD probe at the Institute of Aerospace Medicine, Indian Air Force, has allowed clear recordings with repeatable results. Some of these results appear counterintuitive at a first glance. This paper is an attempt to interpret the changes in cerebral blood flow patterns under +Gz, based on TCD findings.
MATERIAL AND METHODS
The Ethical Committee of the Institute approved the study protocol. Twenty healthy male volunteers consented to participate in the study. They had abstained from alcohol for 12 h and smoking for 2 h before the experiment. The participants were instrumented with electrocardiography, oxygen saturation, thermistor bead for respiratory rate, noninvasive blood pressure recording, and TCD probe (G-rated). The participants were subjected to a gradual-onset rate (GOR) profile at 0.1 G/s until a maximum of +9 Gz or until the participant discontinued the run of his own volition.
A relaxed peripheral light loss (PLL) and straining PLL were recorded in a single GOR profile. The subjects called out “NOW” when they lost the peripheral lights and started straining, thus restoring the lights. When they lost the green lights for the 2nd time, they called out “NOW” again and left the dead man’s switch, which brought the centrifuge to a gradual halt. The point, at which the participants called out, was taken as their relaxed and straining PLL, respectively. All parameters were recorded for 1 min before the run and 1 min after the gondola came to a halt. A 2 MHz Doppler probe was used to study the middle cerebral arterial (MCA) waveform. With the participant seated comfortably in the gondola, the TCD frame is snugly fit to the circumference of the head. The transducer probe, smeared with gel for transduction, was moved around the temporal region just above the zygomatic arch (in front of the ear) to get a signature MCA waveform on the display screen. The probe was then fixed to the frame taking care to not to lose the waveform. An insonation depth to 55 mm was set. A more elaborate method of instrumentation of TCD is given elsewhere.[8]
RESULTS
The TCD data that were retrieved from the system consisted of digital values recorded 200 times per second. On plotting the values in Microsoft Excel®, the TCD waveform was discerned. This pattern was different for different phases of +Gz profile, i.e., pre-run, across the profile, at the PLL, and the post-run pattern.
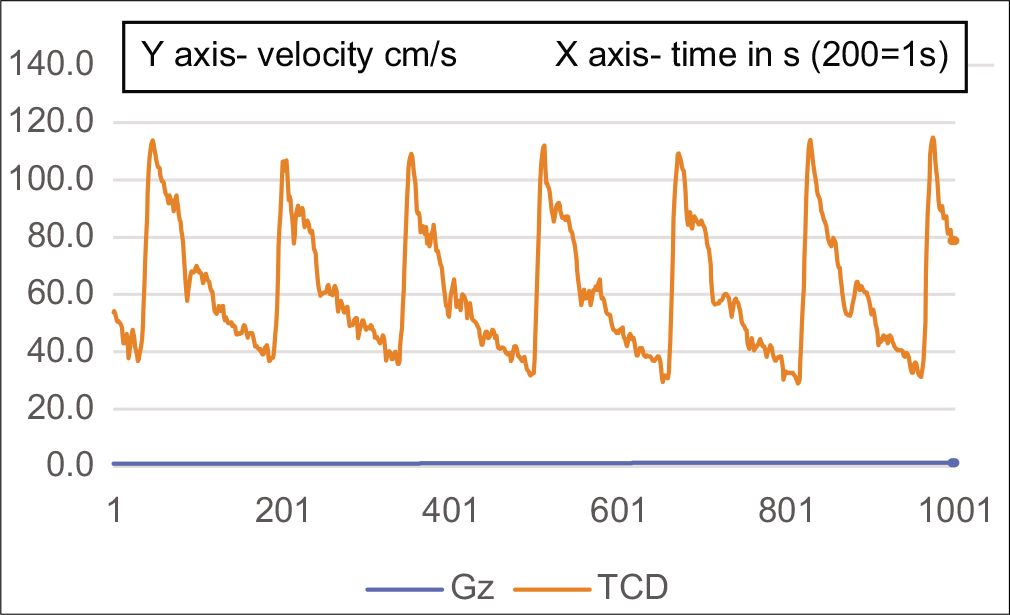
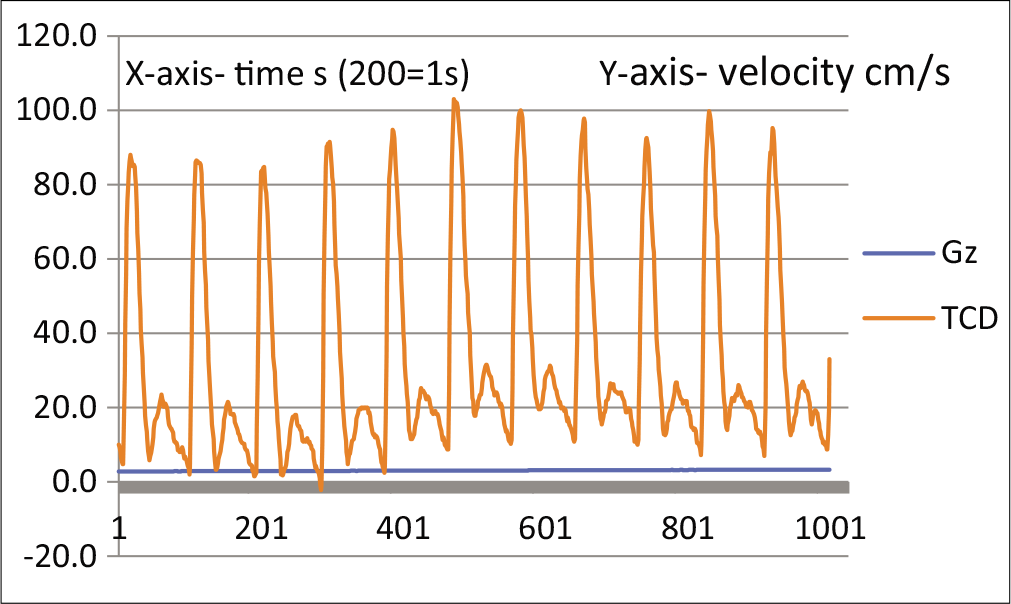
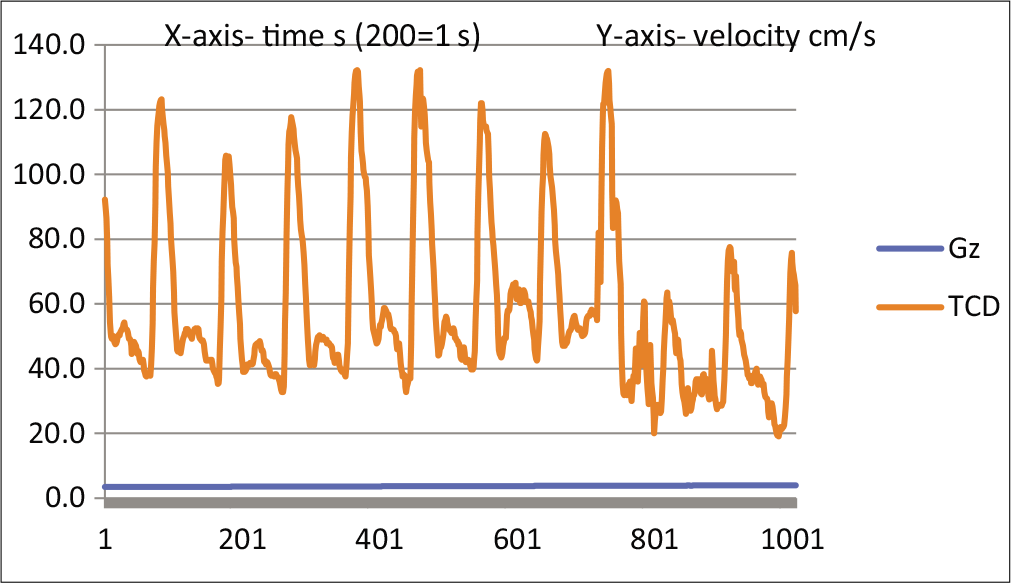
Figure 1 shows a resting TCD tracing. This is a monophasic wave, indicating a low-resistance circulation. Figure 2 shows a TCD tracing as the centrifuge starts and stabilizes at 1.4 Gz. The notch is deepening, which is supposed to indicate an increase in resistance. This deepening of the notch progresses until at around PLL, the circulation becomes biphasic [Figures 3 and 4].

- TCD waveform of MCA at rest.
- TCD waveform of MCA at the start of HPHC.
- TCD waveform of MCA showing deepening of notch at approximately +3Gz.
- TCD waveform of MCA at 1st PLL.
Figure 5 shows TCD tracing for a duration of 15 s, covering the second PLL, and the reduction in acceleration to +1 Gz.
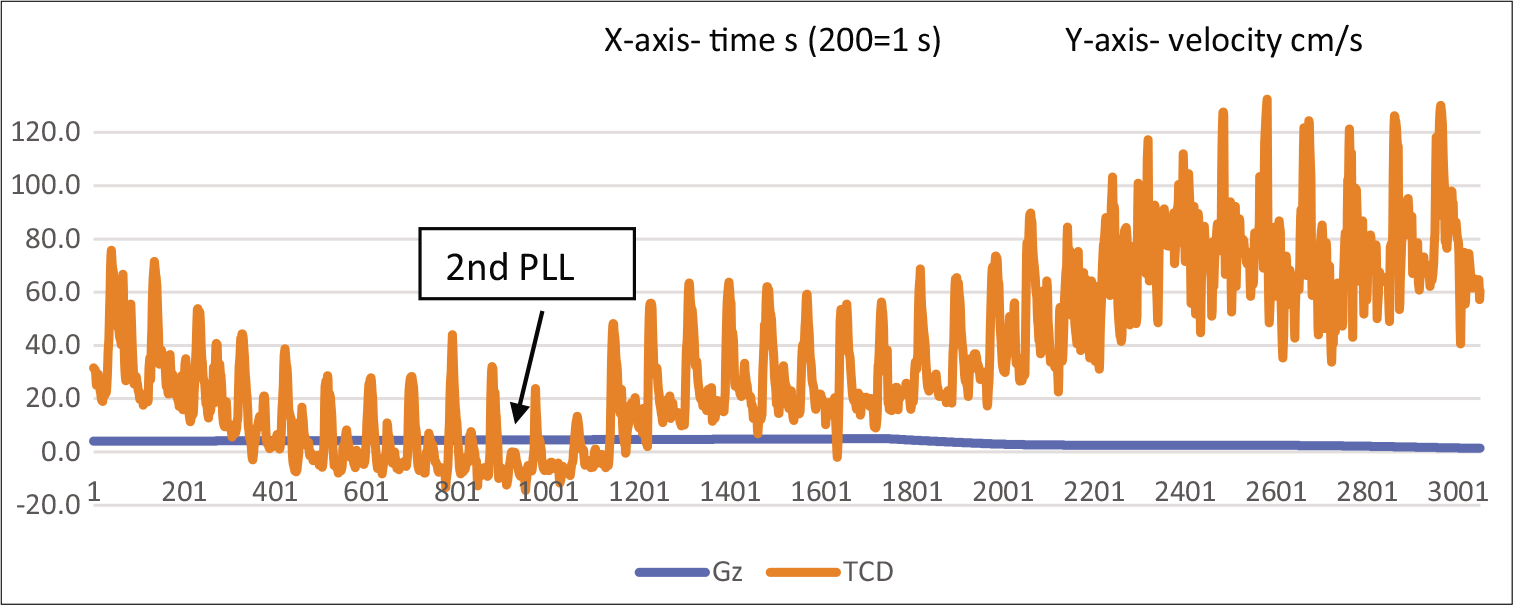
- TCD waveform of MCA at 2nd PLL and return to resting pattern with return of acceleration to +1Gz.
It is important to notice the waveform going beyond the baseline around the second PLL and returning to pre-run values with a return to +1 Gz. The same changes can also be seen with the pulsatility (Gosling) index. The pulsatility index (PI) is a measure of arterial vasoreactivity.[9] It increases with arteriolar vasoconstriction and decreases with arteriolar vasodilation distal to the insonation point.[10] The PI at prerun was 1.3, which rose to 2.0 at PLL 1 and 2.3 at PLL 2. Post-deceleration, PI was 1.56, thus returning to the pre-run value. The index increases as Gz builds up, indicating an increase in arterial resistance.[11-13] Table 1 shows that the PI across the various phases of the run is placed below. The same index has been depicted graphically in Figure 6.
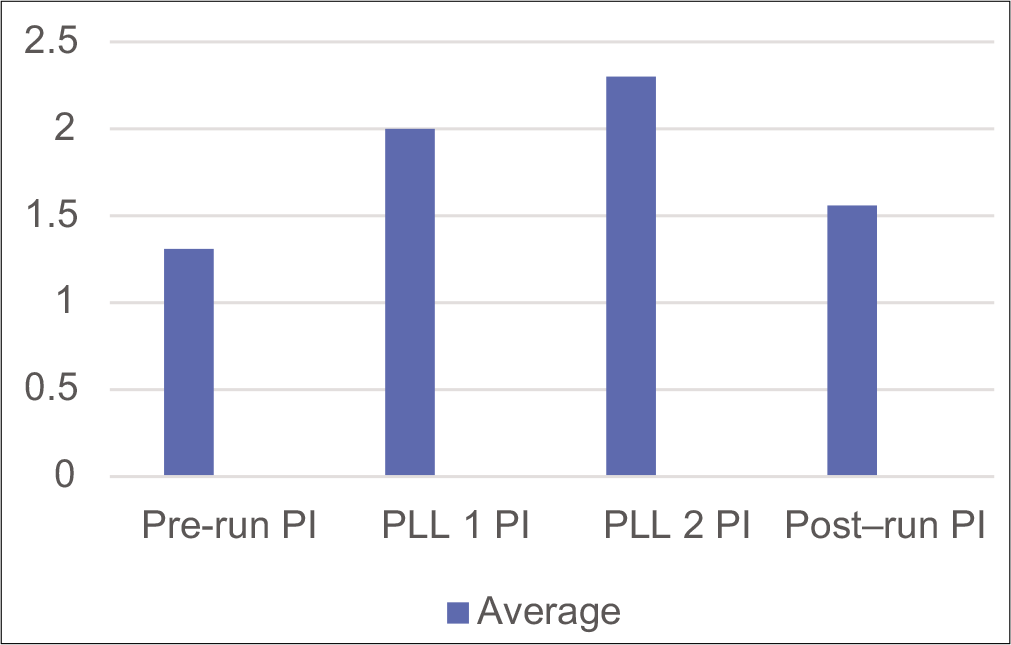
- Pulsatility index during various phases of the run.
| Participant | Pre-run PI | PLL 1 PI | PLL 2 PI | Post-run PI |
|---|---|---|---|---|
| Average | 1.31 | 2.0 | 2.3 | 1.56 |
| Significance | Pre-run PI versus PLL 1** | Pre-run PI versus PLL 2*** | ||
DISCUSSION
An extensive literature search did not show many consistent TCD recordings under high +Gz.[6,7] Moreover, a discussion on the form of the TCD wave and its change under +Gz was not found. It has been seen that the cerebral circulation at rest is represented by a monophasic wave indicating a low-resistance circulation, as against a biphasic wave seen in the limbs due to a high-resistance circulation.[7] Under +Gz, the TCD waveform is being seen to change from monophasic to biphasic. This would indicate an increase in resistance in the cerebral circulation with increasing +Gz. Such an increase in resistance in the cerebral circulation is seen with increasing age, perhaps due to the hardening of arteries.[11-14]
Surprisingly, despite this “increase in resistance”, in addition to the increasing +Gz, the BFV is not reduced with increasing +Gz. The decrease in velocity is seen very close to the second PLL, following which it stays low for some time while the centrifuge slows down and the +Gz is reduced. After the centrifuge comes to a halt, the velocity gradually increases to levels higher than the resting velocity. The entire pattern described above was seen in all the participants where a meaningful Doppler recording could be made. These findings left us with a dilemma as described below:
An increase in resistance under +Gz is difficult to understand.
An increasing arteriolar resistance would further reduce the blood supply to the brain tissues under +Gz. This is counterintuitive.
The fall in cerebral BFV is gradual and not sudden to coincide with the PLL.
The BFV characteristics are different for the first and second PLLs. Hence, it is unlikely that this decrease in BFV is directly linked to PLL.
Although there can be no absolute explanations to satisfy the phenomena described above since the cerebral blood flow is recorded under +Gz, the most plausible explanations which can be offered are as follows:
As the +Gz increases, the hydrostatic pressure of the column of blood opposes the MAP being generated by the heart. This opposition (resistance) is being seen in the TCD, with a waveform similar to that due to arteriolar resistance. However, this is purely a physical resistance.
As the hydrostatic pressure increases further, this results in a backflow during diastole seen as a biphasic wave on TCD. When this backflow becomes significant, it results in PLL.
This was a GOR run. As the baroreceptor reflexes cut in, along with the muscle straining, the blood flow was adequate to perfuse the brain, despite the resistance to circulation.[2] It may be worthwhile to remember here that Burton has described a GOR run as an endurance testing run, rather than a G-level testing run.[15,16] As the endurance gives way, the BFV starts falling, as is seen in the past few seconds preceding the second PLL. When the blood flow becomes inadequate again, this results in the second PLL. The fatigued heart is unable to increase the BFV immediately on the reduction of +Gz, as can be seen clearly from Figure 6. The restoration of peripheral vision, thus, is dependent on reducing resistance, rather than increasing velocity, as vision is restored immediately on reducing +Gz, much before the velocity is restored.
CONCLUSION
It may be interpreted that BFV may be maintained in the face of resistance, without adequate volume flow. It emerges that the characteristic of TCD to be monitored is not its presence or absence (as had been thought heretofore), but its change to a biphasic or triphasic wave, which would indicate a resistance higher than required to maintain cerebral circulation.
Declaration of patient consent
The authors certify that they have obtained all appropriate patient consent.
Financial support and sponsorship
Nil.
Conflicts of interest
There are no conflicts of interest.
References
- The effect of positive acceleration upon the cardiovascular system In: Gillies JA, ed. A Text Book of Aviation Physiology (1st ed). London: Pergamon Press; 1965. p. :578-88.
- [Google Scholar]
- Cardiovascular effects of +Gz acceleration In: Gradwell DP, Rainford DJ, eds. Ernsting's Aviation and Space Medicine (5th ed). Florida, USA: CRC Press; 2016. p. :135-9.
- [Google Scholar]
- The fluid model: Human response to acceleration In: Jeffrey RD, Johnson R, Stepanek J, Fogarty JA, eds. Fundamentals of Aerospace Medicine (4th ed). Philadelphia, PA, USA: Lippincort Williams and Wilkins; 2008. p. :85-8.
- [Google Scholar]
- Effects of +Gz acceleration on the cerebral circulation: Cardiovascular effects of +Gz acceleration In: Gradwell DP, Rainford DJ, eds. Ernsting's Aviation and Space Medicine (5th ed). Florida, USA: CRC Press; 2016. p. :141-2.
- [Google Scholar]
- Noninvasive transcranial Doppler ultrasound recording of flow velocity in basal cerebral arteries. J Neurosurg. 1982;57:769-74.
- [CrossRef] [PubMed] [Google Scholar]
- Remote Control of Transcranial Doppler (TCD) Probe During Centrifuge Exposures up to 9 +Gz. National Defence Research Establishment, Sweden and Armstrong Laboratory, Brooks AFB, Texas, USA, Report No. AD-A275 253.
- [Google Scholar]
- Response of human cerebral blood flow to +Gz accelerations. J Appl Physiol (1985). 1994;76:2114-8.
- [CrossRef] [PubMed] [Google Scholar]
- Comparison of Various Experimental Endpoints of Acceleration Tolerance Against the Standard Endpoint of Peripheral Light Loss (MD Dissertation) Bangalore: RGUHS; 2013.
- [Google Scholar]
- Cerebral blood flow velocity declines before arterial pressure in patients with orthostatic vasovagal presyncope. J Am Coll Cardiol. 2002;39:1039-45.
- [CrossRef] [Google Scholar]
- Transcranial Doppler ultrasonography in anaesthesia and intensive care. Br J Anaesth. 2004;93:710-24.
- [CrossRef] [PubMed] [Google Scholar]
- Transcranial Doppler sonography pulsatility index (PI) reflects intracranial pressure (ICP) Surg Neurol. 2004;62:45-51.
- [CrossRef] [PubMed] [Google Scholar]
- Transcranial Doppler for evaluation of idiopathic intracranial hypertension. Acta Neurol Scand. 2007;116:239-42.
- [CrossRef] [PubMed] [Google Scholar]
- Straining GOR tolerance determinations are a measure of G-duration not G-level tolerance. SAFE J. 1999;29:12-5.
- [Google Scholar]


