
Translate this page into:
A comparison of subjective and objective measures of vestibular adaptation in rotary chair among Indian military aircrew

*Corresponding author: Nandishwar Rathore, Institute of Aerospace Medicine, Indian Air Force, Bengaluru, Karnataka, India. nandishwar_rathore@yahoo.com
-
Received: ,
Accepted: ,
How to cite this article: Rathore N, Dinakar S, Pipraiya R, Rao NA. A comparison of subjective and objective measures of vestibular adaptation in rotary chair among Indian military aircrew. Indian J Aerosp Med 2024;68:42-8. doi: 10.25259/IJASM_21_2024
Abstract
Objectives
Vestibular adaptation time (VAT) refers to subjective assessment of vestibular stimulation in motion environment. While simple, the method is subjective and, hence, is naturally deemed inferior to the objective methods of assessment. Vestibulo-ocular reflex-induced nystagmus, however, can well be used as a quantified measure in a Rotary Chair. Time constant (TC) has conventionally been defined as the time taken for nystagmus to dissipate to 37% of its peak value. Hence, TC becomes an obvious, objective, and more reliable measure for vestibular adaptation. The objective of this study is to compare the VAT and TC in aircrew and determine differences in outcome while using these two different methods.
Material and Methods
Fifty-two healthy male military aircrew with mean age 25.7 ± 4.25 years and median flying experience of 325 h were enrolled in this study after obtaining written informed consent. In the rotary chair, velocity step test was performed, in which the subjects were rotated at an angular velocity of 100°/s. On reaching this constant angular velocity, subjects reported perceived cessation of rotation (per-rotatory). Subsequently, on stopping the chair, the subjects perceived continued rotation in the opposite direction (post-rotatory). The test was then repeated by rotating the subjects in opposite direction. The period from beginning of horizontal rotation till cessation of perceived motion was recorded as the VAT. Simultaneously, the time taken for induced nystagmus to decay to 37% of its peak was recorded by video-oculography and noted as TC. Values of VAT and TC were recorded in per-rotatory and post-rotatory phases in both left and right directions and were statistically analyzed to assess any differences in the outcomes.
Results
Mean VAT for the right and left rotation was found to be 28.22 ± 6.95s and 27.74 ± 6.55s, while mean TC for the right and left rotation was found to be 19.50 ± 5.01s and 18.59 ± 3.99s. Mean VAT was found to be 27.98 ± 6.74s and mean TC was found to be 19.05 ± 4.54s. Bland–Altman graph found 95% of the data points within the upper and lower limits of agreement.
Conclusion
In our study, a higher mean VAT of around 28s and a mean TC of 19s can be attributed to the varying onset and offset rates and angular velocities being used in different studies. Results indicate an offset of 8.925s between values of VAT and TC. However, Bland–Altman plots indicate good agreement and ICC indicates mild reliability between the two tests. This signifies that although there is good agreement between the values of the two tests, further studies may be required to ascertain whether the two parameters may be used interchangeably as a measure of vestibular adaptation.
Keywords
Military aircrew
Time constant
Vestibular adaptation time

INTRODUCTION
Spatial orientation is crucial to flight safety. In the absence of visual and proprioceptive cues, vestibular cues provide orientation about Earth and aid the aircrew in maintaining the desired attitude of the aircraft. The otoliths sense linear acceleration and head tilt, while the semi-circular canals sense angular acceleration. The vestibular organ detects linear and angular velocity changes and converts them into neural signals, which are sent to the central nervous system to reflexively regulate physiological functions.[1] The vestibulo-ocular reflex (VOR) refers to eye movements intended to help with perception by maintaining a steady visual image on the retina during head motion. The main mechanism involved is by moving the eyes in an equal but opposite direction to the movement of the head.[2]
For all sensory systems, the perception of a prolonged or repetitive stimulus generally declines over time through habituation or adaptation at different levels in the nervous system. While central habituation happens when an irrelevant stimulus is disregarded, peripheral habituation develops secondary to receptor desensitization. However, this results in a fundamental shift in how the stimulus is perceived, as evidenced by the opposite after-effect that appears when the stimulus is eliminated.[3]
When the entire body is passively rotated in the dark around the vertical mid-body axis (Z-axis), nystagmus, which is characterized by a slow phase in the opposite direction of rotation, and perception of rotating in the same direction is experienced. As the cupulas of the horizontal semi-circular canals return to their resting position, both these effects decay exponentially to zero after 30–60 s of rotation at constant velocity. On deceleration to rest, the cupulas are deflected in a direction opposite to the initial rotation. Now, the nystagmus occurs with its slow phase component in the same direction as the preceding rotation, and perception of rotation is experienced in the direction opposite to the original rotation. These post-rotatory effects also decay exponentially as the cupulas return to their resting position.[4]
Vestibular adaptation time (VAT) is the simplest method of subjective assessment of vestibular stimulation in a motion environment. The sensation of rotation occurs due to cupular deflection during angular rotation of the vestibular system and ceases when the cupula gains back its shape. However, being a subjective measure of vestibular stimulation, it is less reliable and can be biased. Several studies have used VAT to demonstrate vestibular adaptation.[5,6]
Nystagmus induced due to VOR in the absence of visual cues can be measured. In vestibular testing, the time decay constant or time constant (TC) refers to the time taken for the nystagmus to decay to 37% of its peak slow phase eye velocity.[7-9] This is an objective parameter which reflects vestibular adaptation. The TC has been suggested to be a measure of velocity storage.[10] Furthermore, its value is consistent, reproducible, and not influenced by the participant’s mental or arousal state.[11]
VAT is a subjective parameter; however, it is of practical significance as it quantifies the duration of time for which aircrew gets disoriented during the rotary motion of an aircraft. When assessing VAT, subjective differences in its evaluation might result in inaccurate results. Thus, an objective parameter may provide more consistent findings. As VAT and TC are measures of the velocity storage mechanism of vestibular apparatus, there is a likelihood of correlation between the subjective (VAT) and objective parameters (TC). As there is paucity of literature on this correlation, this study aims to compare the VAT and TC and determine any significant difference in the outcomes of the two methods.[6] The objective of the study is to find the VAT and TC during velocity step test (VST) and compare the two parameters.
MATERIAL AND METHODS
The study was carried out at the neurovestibular laboratory at the Department of Acceleration Physiology and Spatial Orientation at the Institute of Aerospace Medicine. The study group consisted of 52 military aircrew. All the subjects were male and their age ranged from 22 to 45 years with the mean age of 25.73 years. Their flying experience ranged from 95 to 3000 h with average flying hours of 549.8 h. The volunteers were in full flying medical category. Subjects were asked to refrain from alcohol 48 h,[12,13] coffee 6 h,[14] and smoking 2 h[15] before the test. From each subject, written informed consent was obtained. All subjects were briefed regarding the study and timely reporting of cessation of sensation of rotation in the rotary chair. An observational cross-sectional design was used for the study.
Rotational chair testing
This was performed using a Rotary Chair designed by NeuroEquilibrium™ Diagnostic Systems Pvt. Ltd. with its own proprietary software for test analysis. The subject was positioned and secured to the rotary chair with the head adjusted so that both lateral semi-circular canals were close to the plane of stimulus (30° forward tilt).[7-9] Static calibration was done before each experiment. The instantaneous eye position was recorded using video-oculography. During rotation, the subject was instructed to keep his/her neck stable, eyes open, and refrain from moving eyes voluntarily. The VST was used to measure per- and post-rotatory TC during rotations in both right and left directions.[8]
Velocity step test
The VST has two steps. In the first step, the chair was accelerated in one direction at 100°/s2 until it attained a preset constant velocity of 100°/s. This velocity was maintained for a designated duration of time of 45 s for recording of nystagmus.[16] This was termed per-rotatory phase and during this phase a sudden burst of nystagmus was noted as the chair was accelerated (per-rotatory nystagmus). However, the nystagmus decays exponentially as the chair rotates at a constant velocity. The time taken for the nystagmus to decay to 37% of its peak value was noted as per-rotatory TC.[8,9]
In the second step, the chair was decelerated to a complete stop at 100°/s2 and this was termed post-rotatory phase. Sudden deceleration again caused nystagmus (post-rotatory nystagmus) in the opposite direction as the cupula is deflected in the opposite direction and was also perceived as motion in the opposite direction. Nystagmus again decayed exponentially and the post-rotatory TC was noted.[8,9]
The entire procedure was then repeated with the initial rotation in the opposite direction. For both steps in both directions, VAT was also noted as the period from initiation of rotation to complete cessation of perceived rotation. The duration of rotation in the Rotary Chair was fixed (45 s) by original equipment manufacturer for the recording of nystagmus; however, some subjects had per-rotatory VAT >45 s and, thus, had to be excluded as the subsequent rotation of the rotary chair in opposite direction interfered with the recording of per-rotatory VAT.
Statistical analysis
The Statistical Package for the Social Sciences (SPSS)® version 26.0 for Windows (SPSS Inc., Chicago, IL) was used for analysis. Shapiro–Wilk test was used to establish normality for the data acquired. Descriptive statistics were compiled to calculate the means and standard deviation of VAT and TC in all phases of measurements. To identify any systematic differences between VAT and TC, Bland–Altman graph was plotted using Microsoft Excel. Intraclass correlation coefficient (ICC) was used for reliability analysis between the subjective (VAT) and objective measures (TC) of vestibular adaptation. Level of significance was set at P ≤ 0.05.
RESULTS
The demographic data of the 52 military aircrew are presented in Table 1. The large standard deviation in flying hours can be attributed to the seven experienced pilots who had more than 1700 h of flying experience. The median flying hours of aircrew was 325 h (Interquartile range: 275–400 h).
| Range | Mean±SD | Median | |
|---|---|---|---|
| Age (years) | 22–45 | 25.73±4.25 | 25 |
| Flying hours (h) | 95–3000 | 549.8±633.5 | 325 |
SD: Standard deviation
Using the Shapiro–Wilk test for normality, data of VAT and TC in the right and left, per- and post-rotatory phase of the rotary chair were found to be normally distributed. Table 2 shows the descriptive statistics of VAT and TC showing average values during all phases and directions of rotation. An offset of around 8 s can be seen between the means of the two tests.
| Tests | Mean | SD | Range | 95% CI | |||||
|---|---|---|---|---|---|---|---|---|---|
| Minimum | Maximum | Differences | Lower | Upper | Differences | ||||
| VAT (s) | 27.98 | 6.74 | 14.07 | 44.39 | 30.32 | 27.06 | 28.9 | 1.84 | |
| TC (s) | 19.05 | 4.54 | 8 | 33 | 25 | 18.43 | 19.67 | 1.24 | |
VAT: Vestibular adaptation time, TC: Time constant, SD: Standard deviation, CI: Confidence interval
Table 3 shows the descriptive statistics of VAT and TC in both per-rotatory and post-rotatory phases in both directions of rotation. A similar offset can also be seen in the means of VAT and TC in various phases. It is also notable that the range of data points of VAT, as well as their 95% confidence interval, is similar in all the phases of measurements. The range of data points of TC within the 95% confidence limit is also comparable to other phases of measurements. This again indicates the normal distribution of data points in various measurements.
| Tests | Mean | SD | Range | 95% CI | |||||||||
|---|---|---|---|---|---|---|---|---|---|---|---|---|---|
| Minimum | Maximum | Differences | Lower | Upper | Differences | ||||||||
| VAT (s) | |||||||||||||
| RT_PER | 30.33 | 6.62 | 16.56 | 42.47 | 25.91 | 28.49 | 32.18 | 3.69 | |||||
| RT_POST | 26.11 | 6.69 | 14.07 | 39.74 | 25.67 | 24.25 | 27.98 | 3.73 | |||||
| LT_PER | 29.2 | 6.89 | 18.44 | 44.39 | 25.95 | 27.28 | 31.12 | 3.84 | |||||
| LT_POST | 26.27 | 5.89 | 15.4 | 42.72 | 27.32 | 24.63 | 27.91 | 3.28 | |||||
| TC (s) | |||||||||||||
| RT_PER | 19.48 | 5.21 | 9 | 33 | 24 | 18.02 | 20.93 | 2.91 | |||||
| RT_POST | 19.53 | 4.86 | 8 | 30 | 22 | 18.18 | 20.89 | 2.71 | |||||
| LT_PER | 19 | 4.02 | 11 | 26 | 15 | 17.87 | 20.12 | 2.25 | |||||
| LT_POST | 18.19 | 3.95 | 9 | 26 | 17 | 17.09 | 19.29 | 2.2 | |||||
VAT: Vestibular adaptation time, TC: Time constant, SD: Standard deviation, CI: Confidence interval, RT: Right, LT: Left.
As these two parameters, VAT and TC, are subjective and objective measures of the same mechanism, that is, vestibular adaptation, it is prudent to identify any systematic differences between the measurements or possible outliers. This can be done using Bland–Altman plots for VAT and TC in their corresponding phases.
As reflected in the Bland–Altman plots [Figures 1-4], it is understood that 95% of the data points in all the phases of measurements fall within the upper and lower limits of agreement with an average bias of 8.925 s ranging from 6.57 s to 10.85 s. This shows good agreement between the values of VAT and TC in the corresponding phases of measurements.
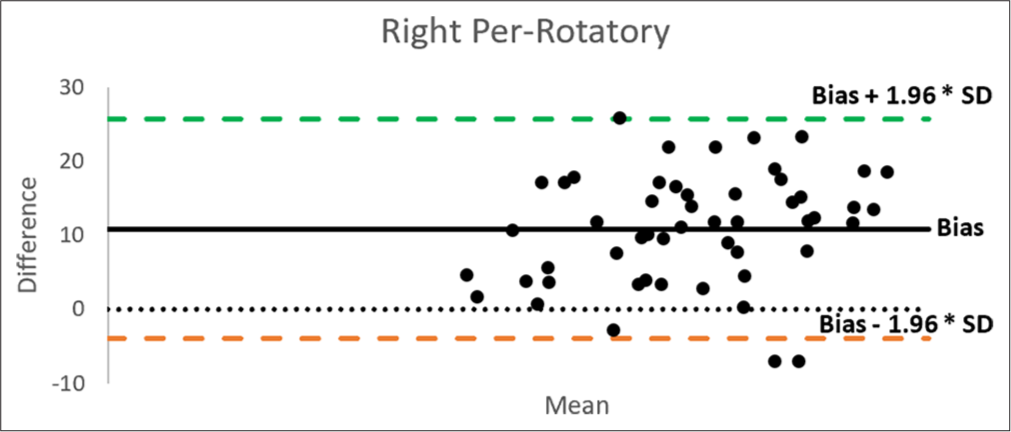
- Bland–Altman plot of vestibular adaptation time and time constant in the right per-rotatory phase. SD: Standard deviation.
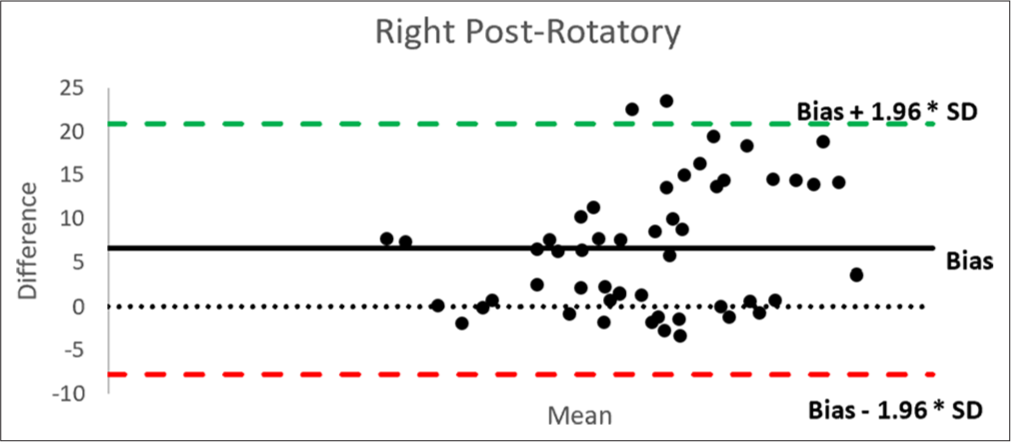
- Bland–Altman plot of vestibular adaptation time and time constant in the right post-rotatory phase. SD: Standard deviation.
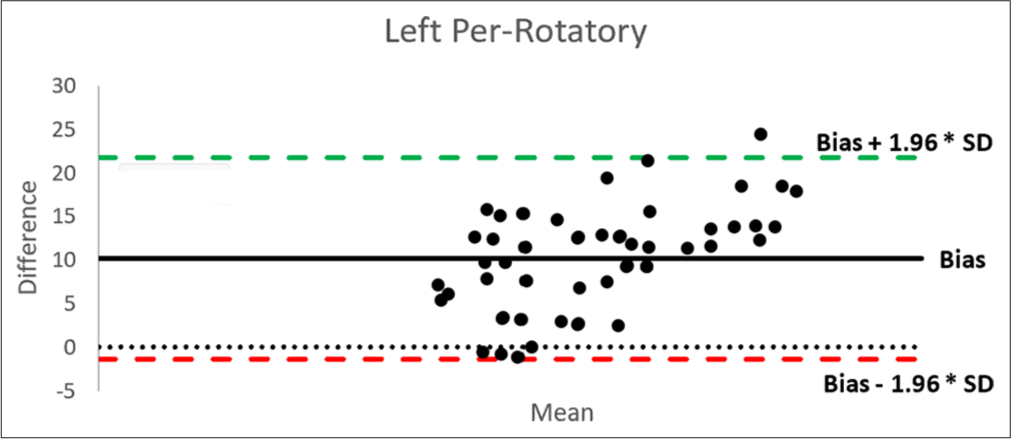
- Bland–Altman plot of vestibular adaptation time and time constant in the left per-rotatory phase. SD: Standard deviation.
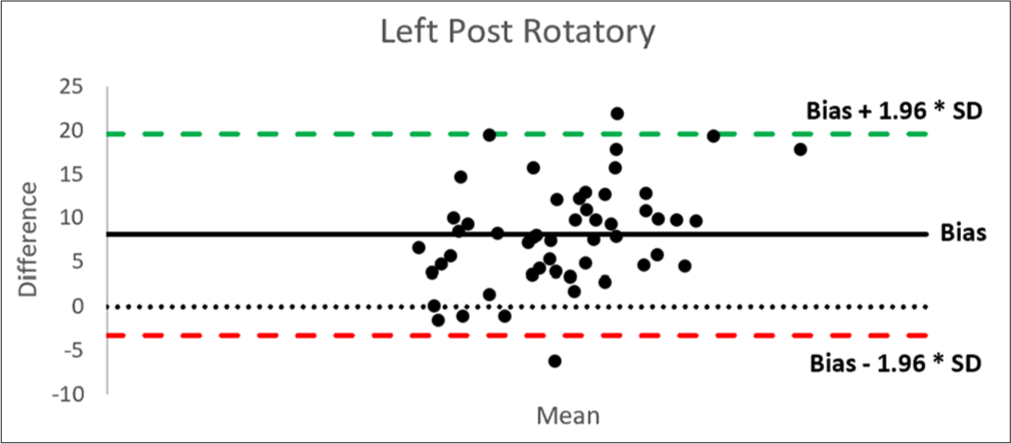
- Bland–Altman plot of vestibular adaptation time and time constant in the left post-rotatory phase. SD: Standard deviation.
Furthermore, the ICC was used for reliability analysis. ICC for all values of VAT and TC in their corresponding phases of measurements was 0.326 (P = 0.081, 95% CI: −0.174– 0.613) for the right per-rotatory, 0.364 (P = 0.054, 95% CI: −0.107–0.635) for the right post-rotatory, 0.627 (P = 0.000, 95% CI: 0.350–0.786) for the left per-rotatory and 0.491 (P = 0.009, 95% CI: 0.113–0.708) for the left post-rotatory phase. The mean ICC was found to be 0.428 (P = 0.024, 95% CI: 0.004–0.672). The ICC indicates mild reliability between the two tests in various phases of measurements.
DISCUSSION
Efforts to quantify vestibular adaptation have been made time and again with varying results. The test wherein VAT was measured by noting the subjective cessation of turning sensation by the subject was termed “cupulometry” and was measured as early as in 1948 by Hulk and Jongkees.[17] They obtained an increasing duration of turning sensation from 9.5 s to 21.2 s on increasing the angular velocities from 9°/s to 52°/s in 50 subjects. Similar experiment was performed on 200 subjects by Aschan et al. in 1952 and they obtained increasing duration of sensation cupulograms from 5.6 s to 23 s for the same set of angular velocities.[18]
Brand in 1968 also measured the VAT in 24 subjects with varying angular velocities and found a duration of 24.5 s at 60°/s angular rotation.[6] By giving repetitive stimuli of varying angular velocities over 9 days, a decreasing trend of VAT was discovered which was attributed to habituation processes which are akin to the “tolerance” which develops on repeated exposures to other forms of unfamiliar labyrinthine stimulation.[19-21] Howard et al., in 1998, measured VAT in 10 subjects while rotating at an angular velocity of 72°/s and onset and offset rates of 28.5°/s2 and found it to be 24.4 s.[22]
In the present study, we found an average VAT of 27.98 ± 6.74 s in a sample of 52 male military aircrew. Similar studies to quantify VAT have been done with varying results and these studies are shown in Table 4. The results are comparable to some of the studies; however, since these studies have varying onset, offset rates, and angular velocities, the results cannot be statistically compared.
| Sr. No. | Investigator (year) | N | Angular velocity (°/s) | VAT (s) |
|---|---|---|---|---|
| 1. | Hulk and Jongkees (1948)[17] | 50 | 9 | 9.5 |
| 52 | 21.2 | |||
| 2. | Aschan et al. (1952)[18] | 94 | 9 | 5.6 |
| 52 | 23 | |||
| 3. | Brand (1968)[6] | 24 | 60 | 24.5 |
| 4. | Howard et al. (1998)[22] | 10 | 72 | 24.4 |
| 5. | Kumar (2019)[24] | 30 | 30 | 35.16 |
| 45 | 42.71 | |||
| 60 | 51.92 | |||
| 6. | Present study | 52 | 100 | 27.98 |
VAT: Vestibular adaptation time
Louis Levy first measured the average duration of nystagmus in 541 aviators in 1919.[23] Since then, many studies have measured TC for nystagmus, post-rotation at various angular velocities. They have been compiled in Table 5.
| Sr. No. | Investigator (year) | n | Angular velocity (°/s) | TC (s) |
|---|---|---|---|---|
| 1. | Brand JJ (1968)[6] | 16 | 60 | 15.1 |
| 2. | Ahmed M (2014)[9] | 100 | 100 | 16.4 |
| 3. | Howard et al. (1998)[22] | 10 | 72 | 15.5 |
| 4. | Karch et al. (2018)[25] | 47 | 60 | 10.36 |
| 240 | 6.73 | |||
| 5. | Present study | 52 | 100 | 19.05 |
TC: Time constant
In the present study, a mean TC of 19.05 ± 4.54 s was found. The results are comparable to some of the studies mentioned above; however, it can be seen that normative values of TC vary depending on the parameters of measurement such as angular velocity as well as rates of angular acceleration and deceleration. The studies mentioned above differ in the values of angular velocity or angular acceleration/deceleration which could affect the TC as the semi-circular canals behave as mechanical integrators, sensing the accumulation of angular acceleration over time.[26] Due to this reason, variations in TC can be seen even if angular velocity is same as in the study by Ahmed.[9] Cupular deformation is a result of both acceleration as well as the duration of the accelerative force. Thus, higher angular velocity in VST will cause greater deformation in cupula due to exposure to accelerative forces for a longer period. This will lead to higher slow phase eye velocity in the resulting nystagmus.[8] On the other hand, the values of TC are relatively stable over wide range of angular velocities (0–250°/s), but show a decreasing trend over 120°/s.[27]
The adaptation of the canal-cupula system to rotation occurs through peripheral as well as central mechanisms. St George et al. found that the TC for the peripheral canal-cupula adaptation was 7.3 s.[3] Baloh et al. also found that in the absence of any acceleration or deceleration, the visco-elastic forces will cause the cupula to return to its resting position in 4–7 s.[27] However, a central brainstem mechanism prolongs the fast canal-cupula adaptation, causing the signals that drive both the VOR and the perception of rotation to outlive the peripheral signal of head rotation. This is referred to as the “velocity storage” mechanism and it prolongs the TC of nystagmus decay to 15–30 s in the absence of visual input.[28-30]
In our present study, we found an average VAT of 27.98 ± 6.74 s and a mean TC of 19.05 ± 4.54 s which are comparable to several previous studies. Moreover, even after an extant literature search, no study indicating the comparison between VAT and TC could be found.
In Bland–Altman plots, there is an average bias of 8.925 indicating that on average, values of VAT are higher than that of TC by 8.925 s. Similar differences can be seen in the studies mentioned above as well.[6,22] Notably, 95% of the data points in various phases of measurements fall within the upper and lower limits of agreement indicating good agreement between the measured values of VAT and TC. The ICC indicates mild reliability between the two tests in various phases of measurements. A larger sample size might be needed to obtain good reliability between the two measures. Both agreement and reliability must be good to unequivocally state that the two measures can be used interchangeably.
The limitation of this study is that although visual stimulus is completely blocked, proprioceptive sensations do interfere with the accurate reporting of VAT by the subject. Due to the pre-set duration of the rotation of the chair by OEM, data of subjects with VAT >45 s were discarded. Furthermore, the onset and offset rates of rotation in rotary chair (100°/s) could not be changed to see their effect on VAT and TC.
CONCLUSION
The study brought out that even though there is a difference between the means of VAT and TC, there is good agreement between the corresponding values of the two tests. However, mild reliability indicates that further studies with a larger sample size are required to ascertain whether the two tests can be used interchangeably. Literature on comparison between the subjective and objective measures of the vestibular system is scarce. Future studies can be planned to compare the two parameters at varying angular velocities, onset and offset rates to better test the agreement between the two tests.
Ethical approval
The research/study has been approved by the Institute of Aerospace Medicine on 19th February 2021.
Declaration of patient consent
The authors certify that they have obtained all appropriate patient consent.
Conflicts of interest
Rahul Pipraiya is on the editorial board of the journal.
Use of artificial intelligence (AI)-assisted technology for manuscript preparation
The authors confirm that there was no use of artificial intelligence (AI)-assisted technology for assisting in the writing or editing of the manuscript and no images were manipulated using AI.
Financial support and sponsorship: Nil.
References
- Understanding vestibular-related physiological functions could provide clues on adapting to a new gravitational environment. J Physiol Sci. 2020;70:17.
- [CrossRef] [PubMed] [Google Scholar]
- The relationship of vestibulo-ocular reflex with self-reported dizziness handicap in patients with vestibular deafferentation. Ear Nose Throat J. 2021;100:NP299-307.
- [CrossRef] [PubMed] [Google Scholar]
- Adaptation of vestibular signals for self-motion perception. J Physiol. 2011;589:843-53.
- [CrossRef] [PubMed] [Google Scholar]
- A quantitative study of vestibular adaptation in humans. Acta Otolaryngol. 1970;70:126-35.
- [CrossRef] [PubMed] [Google Scholar]
- Response to rotatory stimuli in fighter pilots. Acta Otolaryngol. 1954;43:24-31.
- [CrossRef] [PubMed] [Google Scholar]
- The effect of repetition on measurements of post-rotational turning sensation and nystagmus in man. Q J Exp Physiol Cogn Med Sci. 1968;53:312-26.
- [CrossRef] [PubMed] [Google Scholar]
- Background and technique of rotational testing In: Jacobson GP, Newman CW, Kartush JM, eds. Handbook of balance function testing. San Diego, CA: Singular Publishing Group; 1997. p. :237-48.
- [Google Scholar]
- Standardization of rotatory chair velocity step and sinusoidal harmonic acceleration tests in an adult population. Adv Arab Acad Audio-Vestibul J. 2014;1:80-6.
- [CrossRef] [Google Scholar]
- Eye movements to yaw, pitch, and roll about vertical and horizontal axes: Adaptation and motion sickness. Aviat Space Environ Med. 2002;73:436-44.
- [Google Scholar]
- Normative data and test-retest reliability of the sinusoidal harmonic acceleration test, pseudorandom rotation test and velocity step test. J Vestib Res. 2008;18:197-208.
- [CrossRef] [PubMed] [Google Scholar]
- Aftereffects of various alcoholic beverages on positional nystagmus and coriolis acceleration. Aerosp Med. 1970;41:429-35.
- [Google Scholar]
- Positional alcoholic nystagmus (PAN) in man following repeated alcohol doses. Acta Otolaryngol. 1975;79:15-29.
- [CrossRef] [PubMed] [Google Scholar]
- Evaluation of the caffeine effect in the vestibular test. Braz J Otorhinolaryngol. 2005;71:758-62.
- [CrossRef] [PubMed] [Google Scholar]
- The influence of tobacco smoking, nicotine, CO and CO2 on vestibular nystagmus. Acta Otolaryngol. 1969;68:118-26.
- [CrossRef] [PubMed] [Google Scholar]
- The turning test with small regulable stimuli; the normal cupulogram. J Laryngol Otol. 1948;62:70-5.
- [CrossRef] [PubMed] [Google Scholar]
- The rotation test cupulometric data from 320 normals. Acta Otolaryngol. 1952;42:451-9.
- [CrossRef] [PubMed] [Google Scholar]
- Fatigue and adaptation of the cupular mechanism of the human horizontal semicircular canal: An experimental investigation. Proc R Soc Lond B Biol Sci. 1953;141:542-61.
- [CrossRef] [PubMed] [Google Scholar]
- Effect of drugs on motion sickness produced by short exposures to artificial waves. Lancet. 1959;1:853-6.
- [CrossRef] [PubMed] [Google Scholar]
- Habituation to complex vestibular stimulation in man: Transfer and retention of effects from twelve days of rotation at 10 rpm. Percept Mot Skills. 1965;21:459-81.
- [CrossRef] [PubMed] [Google Scholar]
- Post-rotatory nystagmus and turning sensations after active and passive turning. J Vestib Res. 1998;8:299-312.
- [CrossRef] [PubMed] [Google Scholar]
- Vestibular reactions in five hundred and forty-one aviators. J Am Med Assoc. 1919;72:716-7.
- [CrossRef] [Google Scholar]
- Comparative study on vestibular adaptation time and physiological parameters at different rates of angular (yaw) motion [dissertation] Bengaluru: Rajiv Gandhi University of Health Sciences; 2019. p. :44.
- [Google Scholar]
- A Normative study of rotational vestibular testing among U.S. Military Rotary-Wing aviators Alabama: United States Army Aeromedical Research Laboratory; 2018.
- [Google Scholar]
- Spatial Orientation and disorientation in flight In: Rainford DJ, Gradwell DP, eds. Ernsting's aviation and space medicine (5th ed). Boca Raton: CRC Press; 2015. p. :299.
- [Google Scholar]
- Impulsive and sinusoidal rotatory testing: A comparison with results of caloric testing. Laryngoscope. 1979;89:646-54.
- [CrossRef] [PubMed] [Google Scholar]
- Velocity storage in the vestibuloocular reflex arc (VOR) Exp Brain Res. 1979;35:229-48.
- [CrossRef] [PubMed] [Google Scholar]
- Velocity storage in labyrinthine disorders. Ann N Y Acad Sci. 1992;656:297-304.
- [CrossRef] [PubMed] [Google Scholar]
- The vestibular system as a model of sensorimotor transformations. A combined in vivo and in vitro approach to study the cellular mechanisms of gaze and posture stabilization in mammals. Prog Neurobiol. 1997;51:243-86.
- [CrossRef] [PubMed] [Google Scholar]


