Translate this page into:
Heart Rate Analysis during Simulated Push-Pull Effect Manoeuvre
Abstract
Push-pull effect is considered as an important contributing factor in G-induced loss of consciousness (G-LOC) related aircraft accidents. Research concerned with the physiology of push-pull effect, attributed it to the delay in Autonomic Nervous System (ANS) response manifested as delayed Heart Rate (HR) and Blood Pressure (BP) recovery, which in turn resulted in decreased +Gz tolerance. As the HR is an important factor depicting ANS response, this study was conducted to analyse the HR response during a simulated push-pull effect manoeuvre. 18 healthy male volunteers aged between 25-40yrs participated in this study conducted in the High Performance Human Centrifuge (HPHC). Each subject had undergone a control run of increasing +Gz epochs and a push-pull run in which each increasing +Gz epochs was preceded by a-1.5Gz exposure of 10 sec duration. The onset and offset rates were IG/sec. HR was recorded one minute before starting the run, throughout the run and one minute after the run. Minimum baseline HR (HRb-min), peak HR during +Gz (HRpeak) and minimum HR achieved in post +Gz phase (HRmin-post ) were compared between +3Gz epochs of control run and comparable epochs of push-pull run using student t test. Also the time taken to attain the HRpeak (THR-peak) from the start of +Gz plateau and time taken to attain the HRmin-post (THR-min-post ) from cessation of +Gz exposure were compared between the runs using student t test. All the three HR readings did not show any significant difference between +3Gz control run and push-pull run. However the time readings THR-peak and THR-min-post were significantly higher in push-pull run. THR-peak was 12.2 (±3.8) vs 14.8 (±2.3), p=0.01 and THR-min-post was 11.5 (±6.0) vs 20.6 (±9.3), p<0.001 for the+3Gz control run and the push-pull run respectively. HR analysis during push-pull effect did not show any difference in the peak HR or the post +Gz baseline HR when compared w ith pure +Gz run. However there were significant delay for attaining the peak HR during +Gz phase and minimum HR during post +Gz phase of push-pull run. This may be attributed to the delay in recovery of autonomic nervous system following ×Gz exposure. The ANS impairment therefore seemed to be persisting long after the push-pull exposure.
Keywords
Push-Pull Effect
Heart Rate Analysis
Autonomic Nervous System

Introduction
Modern fighter jets often engage in manoeuvres which lead to sudden changes in magnitude and direction of acceleration [1]. Such manoeuvres are necessary to gain tactical advantage over the adversary. Some of those manoeuvres involve rapid transition from negative (-Gz) to positive (+Gz) accelerations [2]. Several researchers had reported that such transitions would lead to significant decrements in +Gz tolerance which was directly related to magnitude and duration of preceding -Gz [3,4,5]. This phenomenon was termed as “Push-pull effect” by Banks et al considering the input on control stick during a bunt manoeuvre [3,6].
Push-pull effect was directly implicated in several G-induced loss of consciousness (G-LOC) related accidents in leading Air Forces in the world such as U.S. Air Force, U.S. Navy and Canadian Air Force [7,8]. Surveys conducted in Royal Air Force and Canadian Air Force revealed that the mishaps were only tip of the ice berg considering the high incidence of in-flight G-LOC attributed to Push-pull effect [9,10.11].
The physiological basis of Push-pull effect was studied by several researchers using Tilt Tables. Coriolis Acceleration Platform and Human Centrifuges [1,2,3,4,5]. The present consensus is that there would be a significant delay in baroreceptor mediated recovery of Heart Rate (HR) and arterial BP after -Gz exposure which in turn contribute to reduction in +GZ tolerance during push-pull effect [3,4,5,12,13]. To explore more into the physiology of this phenomenon, this study was conducted to analyse the HR changes during a simulated Push-pull effect manoeuvre in High Performance Human Centrifuge (HPHC).
Materials and Method
The study was conducted at the Department of Acceleration Physiology and Spatial Orientation at the Institute of Aerospace Medicine. Bangalore. The proposed study design and protocol was approved by institute ethics committee.
Subjects
18 healthy male, non-aircrew volunteers aged between 25-40 yrs participated in the study. Informed written consent was obtained from each subject after explaining the details of the experiment and the risks involved. They were instructed to abstain from tobacco and alcohol about 24 hours prior to the experiment and to avoid coffee and strenuous exercise from morning on the day of experiment. They were also instructed to have adequate sleep on the previous night of the experiment.
High Performance Human Centrifuge (HPHC)
HPHC in which the experiment was conducted consisted of drive assembly, main arm and a gondola. Main drive motor worked on the principle of Direct Torque Control (DTC). Length of the centrifuge arm was 8 meters. The gondola was gimballed with active computer cab control. In the dynamic mode -Gz was simulated by 180° pitch down positioning of gondola.
Recording of Heart Rate
Heart rate recording was done from ECG tracings of the Medical Monitoring system available in HPHC. The recordings were started one minute prior to the centrifuge run and continued for one minute after the run.
Centrifuge protocol
Each subject was initially given a control +Gz run followed by a push pull run. One minute baseline recordings were taken at +1 Gz before and after each run. +Gz tolerance was determined as 52-56° PLL. Control run had 15 sec epochs of +Gz starting from +3Gz followed by increments of 0.2Gz in subsequent epochs (See Fig-1). The push-pull run had a preceding 10 sec exposure of-1.5Gz for each +Gz epoch. It started from +2Gz with subsequent increments of 0.2Gz (See Fig-2). The onset and offset rate for both the runs were kept at 1 G/sec. A 30 sec interval at baseline was provided between two epochs.
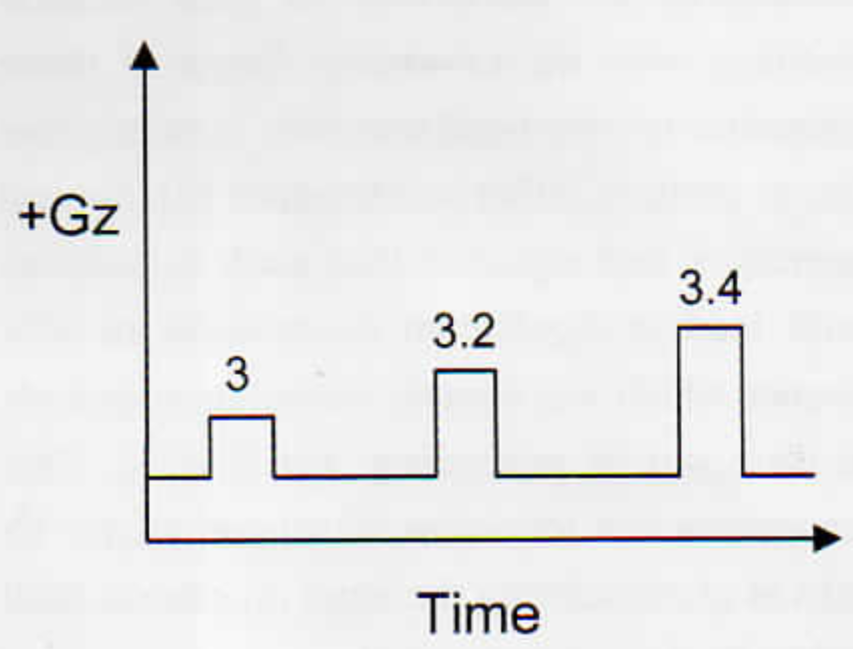
- +Gz run profile
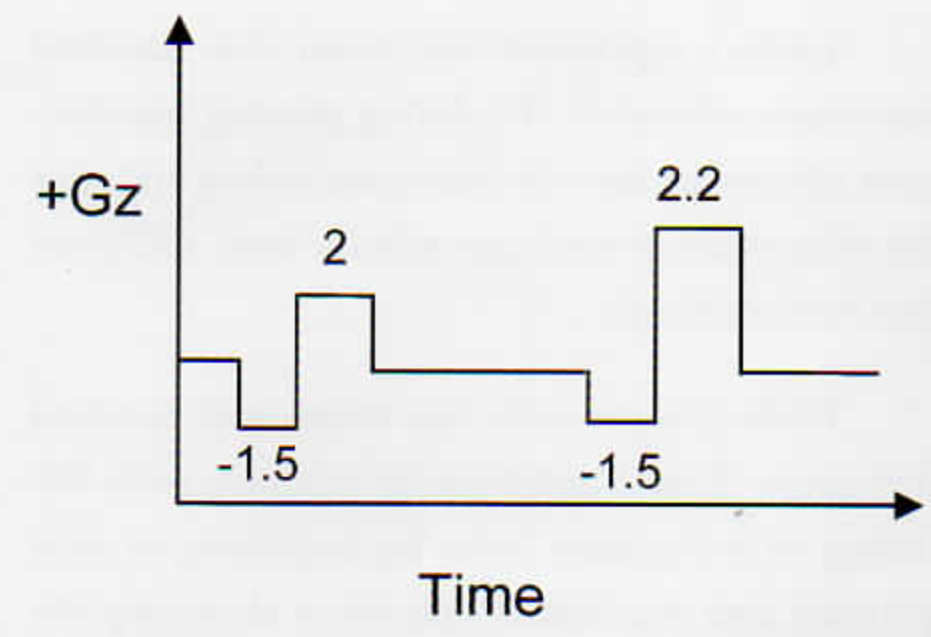
- Push-pull run profile
Analysis of data
The study protocol was part of a larger study comparing +Gz and Push-pull exposures. For the analysis of HR the baseline recording, the recording around the +3Gz epoch of +Gz run and the recording around the Push-pull epoch with comparable +Gz level (closest of +3Gz) of Push- pull run was taken. This was because the lowest +Gz epoch in +Gz run was +3Gz and during the Push-pull run all of the subjects reported PLL before attaining +3Gz level. When the HR was analysed after the study almost all subjects had shown a similar trend. Figure-3 shows the HR response in a subject during +3Gz exposure. It shows that lire HR reaches a peak level from the baseline after a certain time period from the onset of +3Gz and then the HR returns to a lower level once the +3Gz exposure ends. Figure-4 shows that during Push- pull exposure HR reaches a lower level much less than the baseline during the -Gz phase, then returns to higher level during the subsequent +Gz phase and finally returning back to baseline after cessation of +Gz phase.
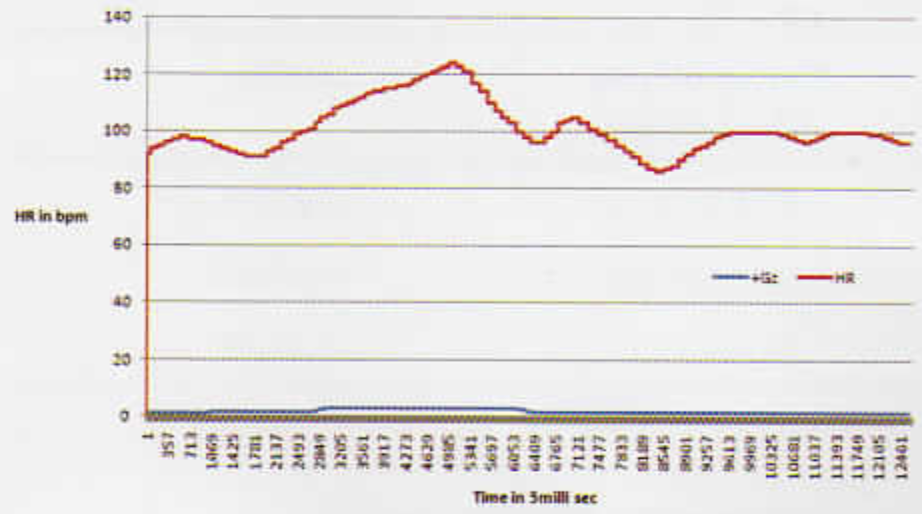
- HR response during +3Gz exposure
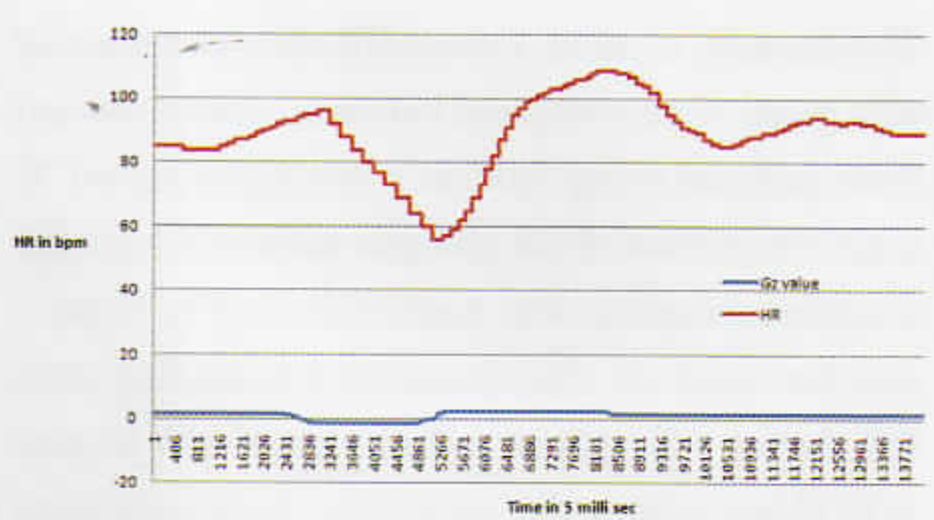
- HR response during Push-pull exposure
For the comparative analysis the lowest resting HR before G exposure were taken as baseline HR (HRb-min) in the respective profiles. The peak HR achieved during the +3Gz exposure (HRpeak+Gz), duration for attaining the peak HR after reaching the plateau of +3Gz (THR-peak+Gz), the lowest HR achieved after offset of +3Gz (HRmin-post+Gz) and the duration for attaining the lowest HR after reaching baseline G (THR-min-post+Gz) were tabulated from +3Gz run. While from Push-pull profile, the lowest HR during x1.5Gz (HRmin-Gz). duration to reach the lowest HR from onset of xl.5Gz (THRmin-Gz). the peak HR achieved during the +Gz exposure (HRmax+GzPP), duration for achieving the peak HR after reaching the plateau of +Gz (THRmax+GzPP). the lowest HR achieved after offset of +Gz (HRmin-post-PP) and the duration for attaining the lowest HR after reaching baseline G (THRmin-post-PP) were tabulated.
Statistical Analysis
HR and duration to attain the HR were tabulated for +Gz control run and Push-pull run. HR was tabulated as that of baseline, +Gz phase and post +Gz phase of +3Gz run and Push-pull run. They were compared using Student’s two tailed paired ‘f test. The duration to attain peak HR during +Gz phase of control run and Push-pull run were compared using Student’s two tailed paired ‘t’ test.
The duration to attain lowest HR after cessation of +Gz phase were compared between control run and Push-pull run using Student's two tailed paired ‘t’ test. Comparison of HR changes within each profile was done using one-way Anova followed by Tukey’s post hoc analysis. The durations for attaining peak HR during +Gz phase and minimum HR in post +Gz phase within the same run were compared with Student's two tailed paired ‘t’ test. Level of significance (p) was kept less than 5%.
Results
18 healthy male volunteers participated in the study. Their mean age, mean height and mean weight were 30.18(±4.24) yrs, 172.0(±5.31) cm and 67.16(±7.16) kg, respectively. All the control run HR readings were taken dining +3Gz. However, during the Push-pull run none of the subjects reached the +3Gz level due to decreased +Gz tolerance. So the Push-pull exposure with highest level of +Gz was taken for analysis. The mean and standard deviation +Gz level of Push-pull run was +2.45(±0.21)Gz.
Table-1 represents the mean and standard deviations of lowest HR during pre-run baseline, peak HR during the +Gz phase and lowest HR after the +Gz phase in beats per min for both +3Gz run and Push-pull run.
| Relaxed ROR +Gz run Mean (±SD) | Push-pull run Mean (±SD) | p value | |
|---|---|---|---|
| Pre-run baseline | 85.9 (±8.3) | 87.8 (±12.1) | 0.479NS |
| During +Gz phase | 129.8 (±17.9) | 127.0 (±13.1) | 0.569NS |
| Post +Gz phase | 95.9 (±21.5) | 99.6 (±15.1) | 0.431NS |
NS: Not significant
Table-2 represents the mean and standard deviations of time durations for attaining peak HR during +Gz exposure from the beginning of 4-Gz plateau and minimum HR after reaching the baseline from +Gz exposure respectively during both profiles.
| Relaxed ROR+Gz run Mean (±SD) | Push-pull run Mean (±SD) | p value | |
|---|---|---|---|
| +Gz phase | 12.2 (±3.8) | 14.8 (±2.3) | 0.014* |
| Post +Gz phase | 11.5 (±6.0) | 20.6 (±9.3) | <0.001** |
Table-3 shows comparison of mean and standard deviations of HR during pre-run baseline. +3Gz phase and post +3Gz phase of Control run.
| Variables analysed | Heart rate in bpm Mean (±SD) | p value |
|---|---|---|
| Baseline vs +Gz phase | 85.9 (±8.3) vs 129.8 (±17.9) | <0.001** |
| Baseline vs Post +Gz phase | 85.9 (±8.3) vs 95.9 (±21.5) | NS |
| +Gz phase vs Post +GZ phase | 129.8 (±17.9) vs 95.9 (±21.5) | <0.001** |
NS: Not significant ** Highly significant
Table-4 shows comparison of mean and standard deviations of HR during pre-run baseline, -Gz phase. +Gz phase and post +Gz phase of Push- pull run.
| Variables analysed | Heart rate in bpm Mean (±SD) | p value |
|---|---|---|
| Pre-run baseline vs -Gz phase | 87.8 (±12.1) vs 74.0 (±15.6) | <0.05* |
| Pre-run baseline vs +Gz phase | 87.8(±12.1) vs 127.0(±13.1) | <0.001** |
| Pre-run baseline vs Post +Gz phase | 87.8 (±12.1) vs 99.6 (±15.1) | NS |
| -Gz phase vs +Gz phase | 74.0 (±15.6) vs 127.0 (±13.1) | <0.001** |
| -Gz phase vs Post +Gz phase | 74.0 (±15.6) vs 99.6 (±15.1) | <0.001** |
| +Gz phase vs Post +Gz phase | 127.0 (±13.1) vs 99.6 (±15.1) | <0.001** |
NS: Not significant *Significant ** Highly significant
Table-5 shows comparison of mean and standard deviations of durations in sec for attaining peak HR during +Gz phase and minimum HR during post +Gz phase of +3Gz run and Push- pull run.
| THRmax during+Gz Phase | THRmin after termination of +Gz | p value | |
|---|---|---|---|
| Control run | 122 (±3.8) | 11.5 (±6.0) | 0.663NS |
| Push-pull run | 14.8 (±2.3) | 20.6 (±9.3) | 0.016* |
NS: Not significant * Significant
Discussion
This study was undertaken to compare the HR changes during a pure +Gz exposure and a Push-pull exposure.
Comparison of peak HR levels
When the min HR recorded before the run. peak HR during +Gz exposure and min HR after +Gz exposures were compared between +Gz and Push-pull exposures using Student ‘t’ test, there were no significant difference (Table-1). This finding is in agreement with those of Goodman et. al., where the Push-pull subjects of different durations of -2Gz had shown similar level of peak HR during subsequent exposure to +2.25Gz which was comparable to peak HR of control subjects exposed to pure +2.25Gz [5]. Hence it may be reasoned that the peak HR achievable during a +Gz exposure is a function of +Gz level, irrespective of the previous “Gz exposure as seen in this study as well as reported by Goodman et. al. [5]. Also in the post +Gz phase the min HR reported in +Gz control run as well as in Push-pull run in this study did not show any significant difference. This also had shown that the HR could come back to similar levels once the +Gz exposure was terminated irrespective of whether pure +Gz or Push-pull exposure. As seen in tables 3 & 4, the minimum pre-run baseline HR and the minimum post +Gz HR did not have any significant differences during both conditions, which again confirmed that the HR attained levels similar to baseline after the G exposure epoch within the 30sec of baseline periods between the epochs of the protocol. Similarly when the HR of different phases were analysed within the profile using One-way Anova and Tukey.s post hoc analysis as given in tables 3 & 4, the -Gz exposure had resulted in significant lowering of HR and the +Gz exposure led to significant increase in HR in accordance with findings reported by earlier studies [6,8,14].
Comparison of time duration
When the time required for attaining peak HR from the start of +Gz plateau was compared between +Gz control and the Push-pull runs, it was significantly higher in the Push-pull run (Table-2). This may be attributed to the delayed autonomic nervous system repose after -Gz exposure reported in several past research works [2,6,12,13]. Similarly when the time to attain minimum HR after +Gz exposure was compared between the profiles, the Push-pull run had shown significant delay compared to pure +Gz run (Table-2). Even though such a finding was not directly reported in the available literature, this can be attributed to the delayed sympathetic vasoconstrictor mechanism as a result of preceding -Gz exposure [2,12,13], which may be still persisting even after subsequent +Gz phase. This therefore can impair the tolerance of subsequent pure +Gz exposure when it occurs during the period of impairment. However measurement of blood pressure and peripheral resistance during the period is important to reach a concrete conclusion.
When the time for reaching peak HR during +GZ and minimum HR during post +Gz in pure +Gz control run was compared using paired ‘t’ test, there was no significant difference (Table-5). This shows similar time period for HR increasing as well as decreasing response. A similar analysis was done in Push-pull run also. However, it was seen that the minimum HR during -Gz phase had reached 11.3 (±2.5) sec which was beyond the duration of - 1.5Gz plateau. Hence it is not sure whether the minimum HR may extend further if the -Gz duration is more than 10 sec. Because of this reason, the minimum HR recorded during -Gz is not considered for the discussion purpose. Nevertheless when the time to attain peak HR during +Gz and minimum HR during post +Gz within Push-pull run were compared (Table-5), there was significant delay in the post +Gz phase in contrary to the observations, of pure +Gz control run. This finding also suggests that delayed sympathetic vasomotor response may be much prolonged than what had been previously thought of.
Push-pull effect is stated to be commonly occurring during training as well as tactical missions. Even though it is classically described in the “bunt then pull” manoeuvre [6], it can also occur after a point roll followed by a pull or sharp turn [16]. Similarly -Gz can be encountered during outside loops and spins, simple inverted flights, unloaded barrel rolls if the pilot is sitting off-centre etc. If such a manoeuvre is followed by rapid build up of +Gz for recovery. Push-pull effect can occur [14]. Most of the trained fighter pilots are aware of such a phenomenon and will be careful to pull higher +Gz immediately after a -Gz exposure. However, what the pilots may not be aware of is the prolonged time period of about 20.6±9.3 sec, even after the Push-pull manoeuvre, during which the decreased tolerance to +Gz is likely to be persisting as evident in this study. If that is the case, such a long period of lowered +Gz tolerance is a significant hazard to flight safety.
Summary and Conclusion
This study was carried out to analyse the HR changes during Push-pull effect. In accordance with earlier research, this study showed that the peak HR achieved during +GZ phase of Push-pull effect is similar to the control run. However there was a significant delay, after -Gz exposure, to attain the similar HR level on subsequent +GZ runs, probably because of delay in the autonomic nervous system response. Also after the termination of G exposure tire HR was found to return back to levels similar to post pure +Gz exposures or baseline, however a significant delay was seen in HR returning to baseline after Push-pull exposure. This could be attributed to persistence of delayed vasomotor response due to preceding -Gz exposure. If the peripheral vasomotor delay persists even after the subsequent +Gz exposure of 15 sec. it may decrease the tolerance to subsequent +Gz exposures if they occur during that impaired period which the pilot may not be aware of. However such a conclusion can only be drawn after studying the blood pressure and peripheral vascular resistance during and after Push-pull effect.
References
- Centrifuge training program with “push-pull” elements. Aviat Space Environ Med. 2005;76:493-5.
- [Google Scholar]
- Carotid sinus pressure changes during push-pull maneuvers. Aviat Space Environ Med. 2006;77:921-8.
- [Google Scholar]
- The effect of varying time at-Gz on subsequent +Gz physiological tolerance (push-pull effect) Aviat Space Environ Med. 1995;66:723-7.
- [Google Scholar]
- Heart rate and blood pressure responses to +Gz following varied duration-Gz. Aviat Space Environ Med. 2000;71:137-41.
- [Google Scholar]
- “Bunt bradycardia”: Two cases of slowing of heart rate infl ight during negative Gz. Aviat Space Environ Med. 1994;65:330-1.
- [Google Scholar]
- The “push pull effect” and G-induced loss of consciousness accidents in the L’S Air Force. Aviat Space Environ Med. 1998;69:1104-6.
- [Google Scholar]
- Human response to acceleration. In: Davis JR, Johnson R, Stepanek J, Fogarty JA, eds. Fundamentals of Aerospace Medicine (4th ed). Lippincot Williams and Wilkins; 2008. p. :83-109.
- [Google Scholar]
- G-induced loss of consciousness: retrospective survey results from 2259 military-aircrew. Aviat Space Environ Med. 2006;77:619-23.
- [Google Scholar]
- Operational implications of Push-pull effect. Aviat Space Environ Med. 1997;68:614.
- [Google Scholar]
- Physiological consequences: cardiopulmonary, vestibular and sensory aspects. Human consequences of agile aircraft In: RTO-TR- 015. Neuilly-sur-Seine, France: Research and technology organization, NATO; 2001. p. :49-58.
- [Google Scholar]
- Impairment of cardiovascular and vasomotor responses during tilt table simulation of “push-pull" maneuvers. Aviat Space Environ Med. 2002;73:971-9.
- [Google Scholar]
- Decreased + Gz tolerance following lower body positive pressure: simulated push pull effect. Aviat Space Environ Med. 2001;72:1045-7.
- [Google Scholar]
- Effects of long duration acceleration In: Rainford DJ, Gradwell DP, eds. Ernsting’s Aviation Medicine (4th ed). New York: Edward Arnold Ltd; 2006. p. :137-58.
- [Google Scholar]
- Negative to positive Gz acceleration transition Current concepts on G protection Research and Development AGARD Report # LS- 202 Neuilly-sur-Seine, France: AGARD conference proceedings NATO; 1995. p. :2-1-2-8.
- [Google Scholar]
- G-transition effects and their implications. Aviat Space Environ Med. 2001;72:758-62.
- [Google Scholar]


