Translate this page into:
Intraocular Pressure and Visual Acuity Changes during 6 hours of Simulated Microgravity by Dry Floatation
Abstract
Introduction:
Intraocular Pressure (IOP) is reported to rise during Parabolic and Space Flights and also during simulation of microgravity in form of Head Down Tilt. However, no study has ever examined IOP changes during Dry Floatation (DF). Additionally, concern that it may be associated with transient impairment of Visual Acuity has also not been addressed, adequately. The study was to examine changes in Intra Ocular Pressure (IOP) and Visual Acuity during microgravity simulation, in the form of thermoneutral (34.5 –35.5ºC), supine Dry Floatation, for 6 hours.
Methods:
IOP, Visual Acuity, Thoracic Impedance, Heart Rate and MAP were measured during DF (20 min, 40 min, 60 min, 120 min, 240 min and 360 min) in 12 healthy male volunteers (28-39 yrs) and compared with baseline values in a ground based supine posture. Additionally, IOP was measured in 6 subjects (n=12 eyes), maintained in a ground based supine posture for 2 hours (every 30 min), to examine the repeatability of the instrument (Keelar Pulsair Non Contact tonometer). Results were analysed using repeated measure ANOVA.
Results:
IOP did not change with the progression of ground based supine posture (F= 0.996; p= 0.413). During DF, IOP changed significantly (F= 13.45; p= 0.000). The values at 20 min and 40 min (19.7 ± 2.9 mm Hg, 19.4 ± 3.2 mm Hg, respectively) were significantly higher (p=0.000, p= 0.001, respectively) than baseline supine values (17.2 ± 3.2 mm Hg). The increase in IOP was much less pronounced than that reported in parabolic or space flights. Values after 60 min of DF were not different (p=0.061), and values during recovery were lower (p=0.008) than supine values. Thoracic Impedance remained higher than baseline values throughout the DF (F=7.747; p=0.001) indicating haemodilution. There was a significant decrease in Heart Rate and MAP that was evident throughout the six hrs of DF (F = 4.476; p=0.011 and F = 3.627; p= 0.021, respectively). However, IOP correlated poorly with Thoracic Impedance (r = -0.06; NS). There was no change in distant or near visual acuity was observed.
Conclusion:
Supine Dry Floatation results into a small and transient increase in IOP, which is not associated with changes in visual acuity. The changes are also not correlated with the extent of haemodilution.
Keywords
Intraocular pressure
Dry floatation
Thoracic impedence
Haemodilution

Introduction
Col Yuri Gagarin crossed the final frontier of Space in an epoch 108 min flight on the 18 Apr 1963. The voyage into space is not without cost and is in the form of profound changes in human physiology. Among the first few changes noticed in astronauts are in their cardiovascular functions [1]. On Earth, hydrostatic forces generated by gravity cause the blood to pool in the periphery. In microgravity condition however, fluid shifts towards the head and torso, because mechanisms that counter the pooling of blood continue to act, unopposed by gravity. The fluid shift occurs fairly early in the flight, within 24 hours, and reaches a steady state with in 3 to 5 days [2]. The quantity of the fluid shift that occurs is about 1.5 – 2 litre approximately. Among other changes produced by this fluid shift, there occur changes in arterial and venous pressures, and also an increase in the Intraocular Pressure (IOP).
Why this concern about raised Intra Ocular Pressure? A persistent rise in IOP can lead to glaucomatous changes in the visual fields. But, even if these changes were to decline after some time, as happens in actual conditions, it still would affect the eye adversely. Kergoat and Durand [3] showed that increased IOP caused a reduction in neuroretinal function in the distal retinal layers, beyond the ganglion cell layer. The rods were perhaps more affected by these changes, as evidenced by the changes in Oscillatory Potentials. These results suggest that microgravity of relatively short durations may cause retinal ischemia, manifest as neuroretinal dysfunction, with yet undetermined effects on visual and overall performance.
This increase in IOP occurs soon after entry into microgravity conditions. In 1986, during the first German Spacelab Mission, Draeger et al [4] investigated these changes for the first time. The first reading was taken 53 min after launch (44 min after entering microgravity), and there was an increase of 20- 25 % with respect to the base line values taken before launch. The values returned towards normal after around 8 hours stay in space. Similar studies were carried out subsequently as well.
As it is not possible to study all physiological changes in actual microgravity conditions, a number of simulation techniques that have been developed, and one of them is by the Water Immersion (WI), first proposed by Leon A Knight [5] in 1960. Immersing a subject in water causes the support medium i.e. water to be evenly distributed over his entire surface and no deformation occurs. In other words, no resultant force is acting on the body thus no weight is felt [5]. One of the concerns of WI has been the maintenance of body hygiene, and problems of skin maceration making long term immersion studies difficult [1,6]. However in 1976, Shulzenko et al [7] described a modification of water immersion model called Dry Immersion (DI) or Dry Floatation (DF). This is essentially similar to the method of water immersion, however here the subject is protected from direct contact with water by a thin waterproof plastic sheet. This is probably the ideal analogue of weightlessness, as it neither has the problems of maintenance of hygiene and skin maceration inherent in water immersion nor the discomfort of head down tilt [1,6,8].
This technique was used in our study to measure changes in IOP, Visual Acuity and Thoracic Impedance over a period of 6 hours. Despite ease of simulation, no previous study has been done to study the IOP changes in DF.
Methodology
Our subjects were 12 healthy male volunteers (29-39 yrs), with no history of Glaucoma and with corrected Distance Visual Acuity of 6/6. The subject reported to the Department of Physiology at 0800 hours on day of test, after breakfast and a good night's sleep. Once in the lab, his height and weight were recorded. To measure Thoracic Impedance, 8 self-adhesive Ag / AgCl electrodes were placed on the subject in the following positions. One pair was placed over the centre of each clavicle and a second pair 5 cm above these on either side in the neck. one pair was placed on the chest at the level of the manubrium sternum, in the mid axillary line on either side. Another pair was placed below these electrodes in the same line. Thoracic Impedance was measured using an Impedance Cardiograph (ICG-M501 ASK Ltd, Budapest, Hungary), which was connected to the electrodes via leads. A baseline reading was taken for 30 sec.
IOP was measured with a Keeler Pulsair 2000 Non contact Tonometer. A pilot reliability study on six subjects, who remained in a supine position for 2 hours, was conducted. A baseline IOP reading was taken and baseline Distance and Near Visual Acuities were determined with a Snellen's Chart and Jaegers Chart respectively. The baseline readings of IOP, Visual Acuity and Thoracic Impedance were all taken in a ground based supine position.
Subsequently, the subject was placed in a supine posture on the hydraulic platform of the Dry Floatation tank and the platform lowered. The subject was now lying on water but separated from it by a thin plastic sheet. The temperature of the water was maintained at thermoneutral level of 34.5 –35.5º C. Subsequent readings were taken at 20 min, 40 min, 60 min, 120 min, 240 min, and 360 min. Last reading was taken after 20 min of recovery, in a ground based supine posture.
Statistical Analysis
Normality of the distribution of data was examined by Shapiro Wilks 'W' statistics. Comparison of 8 measurements of variables involved testing of a multi sample hypothesis. It was analysed through one way Analysis of Variance (ANOVA). Due to significant departures of the data from the assumption of sphericity (tested through Mauchly's Test of Sphericity,) a Greenhouse Geisser correction was employed and degrees of freedom adjusted correspondingly. The significance level reported in the results refers to degrees of freedom so adjusted. After a positive outcome from ANOVA, a resting supine value was compared with the subsequent values during and after DF, using a Paired 't' Test. A Bonferroni correction was not employed, as it is a highly conservative test and may miss real differences. Also it increases the likelihood of Type II errors (the probability of accepting the null hypothesis when the alternative is true) [9].
Results
Intraocular Pressure increased significantly during DF from its baseline value in ground-based supine, resting position. (F = 13.45; p = 0.000). IOP was found significantly more up to 40 min of DF (p = 0.000 - .001). Thereafter, it started reducing and the value at 60 min was not found to be significantly different from the baseline values during resting supine. IOP during recovery was significantly lower than baseline. (Table -1 & Fig -1).
Thoracic Impedance also increased significantly (F=7.747; p=0.001) during DF. All the values during DF were found to be significantly more than the resting supine values. It did not come back to its ground based supine value in 20 min of recovery also (Table-1 & Fig-2).
The correlation between IOP and Z 0was poor (r=0.06) (Fig-3)
| Baseline Supine | Dry Floatation | Recovery | ||||||
|---|---|---|---|---|---|---|---|---|
| 20min | 40min | 60min | 120min | 240min | 360min | |||
| [1] | [2] | [3] | [4] | [5] | [6] | [7] | [8] | |
| IOP | 17.2±2.3 | 19.7±2.9 | 19.4±3.2 | 18.3±2.8 | 16.7±1.8 | 15.9±1.7 | 16.6±1.7 | 15.6±1.9 |
| Z0 (Ω) | 21.8±2.8 | 23.0±2.8 | 22.9±1.7 | 22.9±1.2 | 23.2±3.0 | 22.8±3.5 | 23.2±3.7 | 23.0±1.3 |
| HR (bpm) | 71±11.4 | 66±11.5 | 69±6.9 | 66±8.5 | 60±6.3 | 63±6.1 | 63±6.5 | 62±6.3 |
| MAP (mm Hg) | 92.3±9.9 | 83.8±6.7 | 84.9±8.0 | 87.3±7.6 | 89.6±9.1. | 89.4±7.4 | 92.6±7.4 | 96.6±10.8 |
| IOP [F=13.45; p= .000] |
Z0 [F=7.747; p =.001] |
Heart Rate F=4.476; p=0.011] |
MAP F=3.627; p=.0214] |
| Significant contrasts 2vs1; p=0.000 3vs1; p=0.001 6vs1; p=0.008 8vs 1; p=0.008 |
Significant contrasts 2vs1; p=0 .035 4vs1; p=0.016 5vs1; p=0.005 6vs1; p=0.031 7vs1; p=0.036 8vs1; p=0.014 |
Significant contrasts 2vs1; p=0 .002 5vs1; p=0.000 6vs1; p=0.009 7vs1; p=0.031 8vs1; p=0 .005 |
Significant contrasts 2vs1; p=0.014 3vs1; p=0.047 |
![IOP [Resting, Supine, during 6 Hours of DF & Recovery]](/content/110/2015/59/1/img/IJASM-59-025-g001.png)
- IOP [Resting, Supine, during 6 Hours of DF & Recovery]
![Basal Thoracic Impedance [Resting, Supine, during 6 Hours of DF & Recovery]](/content/110/2015/59/1/img/IJASM-59-025-g002.png)
- Basal Thoracic Impedance [Resting, Supine, during 6 Hours of DF & Recovery]
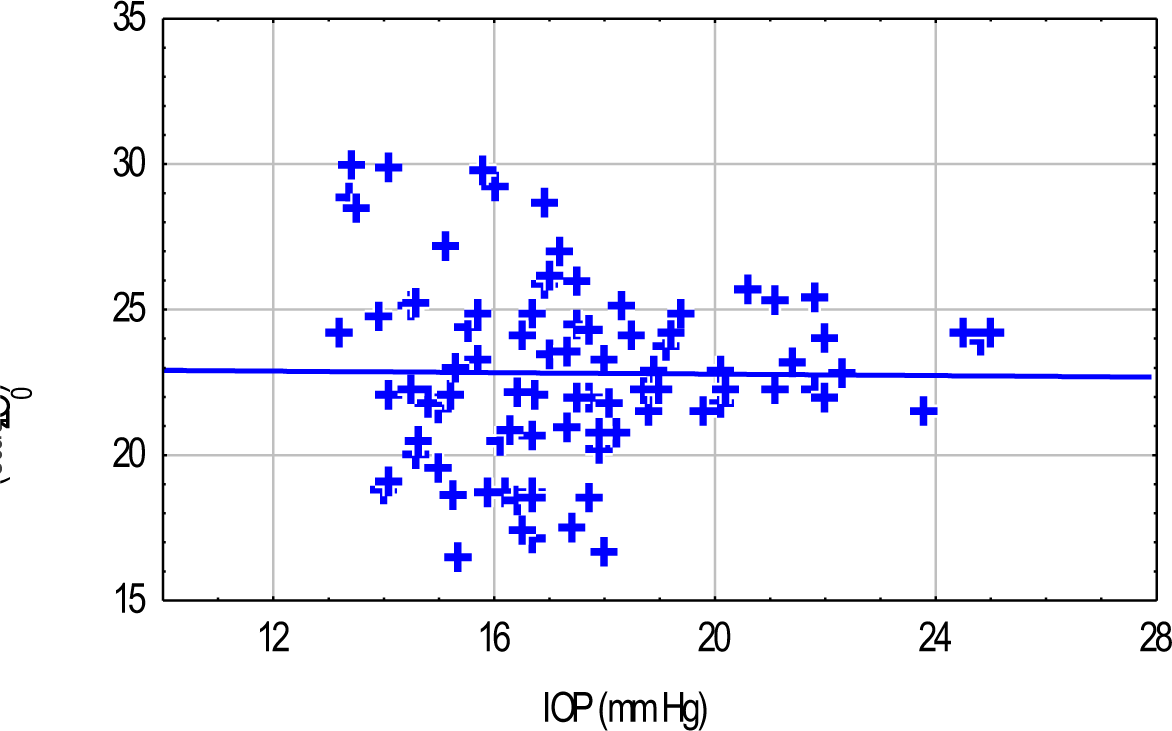
- Scatter Plot Of IOP Versus Thoracic Impedance Showing Poor Correlation
Discussion
This is the first study of its kind on IOP and Visual Acuity changes during Dry Floatation. In the present study, measurements were made in a ground based supine position (and not orthostatic sitting or standing position) and taken as reference values. It was because of the following reasons- 1) There is enough support in the literature for such an approach [10, 11, 2] The changes in IOP after transition from standing to supine posture, even though occasionally reported, are not universally documented and accepted for normotensive eyes (even though it is well documented in patients with glaucoma) [12, 3] No neuroretinal or cortical dysfunction is reported during supine bed rest of this duration. Such dysfunctions are commonly reported during HDT [2,13].
To address concerns about reliability of Keeler Pulsair Tonometer, Intraclass correlation coefficients (ICC) were calculated, for five observations made every 30 min across a period of 2 hours in a group of six healthy male volunteers, in a ground based resting and supine position. Each eye was measured separately and was treated as a separate case. Support is available for such a statistical treatment [14]. The ICC value was 0.83 representing excellent reliability, as per criteria of Shorut and Fleiss [15].
The present study observed a significant increase in IOP during DF (F=13.45; p=0.000). Individual comparison showed that IOP was significantly more during 20–40 min of DF, compared to its value during ground based supine position. From 60 min onward, the IOP settled to alevel, which was not significantly different from that in the baseline condition.
The precise mechanism of this increase in IOP is a matter of speculation. At the first instance, it can be attributed to an increase in the episcleral venous pressure, secondary to an increase in central venous pressure, thought to lead to a decrease in aqueous outflow and a corresponding increase in IOP [16]. The other possible candidates could be a mechanical pressure on the globe, secondary to orbital congestion and intravascular tissue volume, which decreases the internal volume of the eye in effective terms. The time frame, in which IOP increases, after such maneuvers, is more in favour of the latter. This synthesis stems from the fact that an inherently slow production of aqueous (less than or equal to 3 l/ min) will require at least a few minutes to increase the IOP to observed levels in case it were due, primarily, to an outflow obstruction [15]. A very small fluctuation in choroidal volume during positional changes could cause the sudden increase and decrease in IOP.As noted by Smith and Lewis [17], a sudden rise in choroidal blood volume of only 20 µl, could cause an immediate rise in IOP of 20 mm Hg.
The above changes in IOP could reflect adjustments in plasma volume during Dry Floatation. In addition to an immediate cephalad translocation of 700-900 ml of blood volume, there occurs, with the progression of supine immersion, an increase in plasma volume by 8-10% (250-350 ml) in the first 30 min. Thereafter, the plasma volume tends to decrease as a result of diuresis and natriuresis. In addition, there is some evidence tosuggest that the excess fluid starts moving into the intracellular spaces after the first hour of immersion [18].
An attempt was made in the present study, to make a non-invasive assessment of central blood volume by measuring Thoracic Impedance (Z0). Such an approach has been made with an excellent outcome, during transition from standing to supine posture. It was expected, that thoracic impedance would decrease with an increase in central blood volume. However, an increase in thoracic impedance was seen from as early as 20 min of DF. It seems to be paradoxical and in all probability, could be explained due to a reduction in haemoglobin and haematocrit, which is reported in DF in the same time frame (18) , due to transfer of fluid from interstitum to intravascular compartment. The haematocrit is known to affect the resistavity of the blood and this in turn affects impedance (19). A decrease in haematocrit, therefore, was manifest as an increase in thoracic impedance. The Z0 did not come back to its resting supine levels even in recovery. This itself signifies that the cause for increase in Z0 was haemodilution. This also explains an extremely poor correlation between IOP and thoracic impedance.
Notwithstanding significant increase in IOP, no changes in Near or Distance Visual Acuity were noticed across 6 hours of DF. This was also unexpected, in view of a reported deterioration in neuroretinal functions in microgravity simulation by HDT [3,13]. There is no study reporting changes in Visual Acuity during HDT or water immersion. However, occasionally the changes in Visual Acuity have been reported during exposure to actual microgravity. It could be because changes in IOP are of a greater magnitude during exposure to microgravity during parabolic flights and space sojourns compared to those observed during its simulation in form of DF or Head down Tilt.
Conclusion
To examine the effects of simulated microgravity on Intraocular Pressure (IOP) and Visual Acuity, 12 subjects were evaluated during 6 hours of supine Dry Floatation. IOP, Visual Acuity, Thoracic Impedance, Heart Rate and MAP were measured at 20 min, 40 min, 60 min, 120 min, 240 min and 360 min during DF and compared with the corresponding values in a ground based supine posture. IOP increased to a small yet significant extent, in the first 20 and 40 min of DF. Thereafter, it declined and at 20 min of recovery, it was significantly lower than the measured baseline value. Thoracic Impedance increased during remained higher than baseline throughout DF and this increase was understandable in terms of haemodilution and subsequent reduction in haematocrit. Heart rate and MAP decreased and remained lower than baseline values during the 6-hour period. IOP correlated poorly with Thoracic Impedance. There was no change in Distant or Near Visual Acuity. The results indicate that increase in IOP during DF is mild and transient and it does not result into an impairment of Visual Acuity.
Disclaimer
The opinions expressed in this article are those of the author and do not reflect the official views of Indian Air Force or the Indian Society of Aerospace Medicine
References
- Space Physiology and Medicine In: Lea and Febiger USA (3rd edition). Page, p-1, 3, 4, 127, 127, 212-218, 220-226,286
- [Google Scholar]
- space crews: An overview and perspective In: Hwang NHC, Normann NA, Baltimore MD, eds. Cardiovascular flow dynamics and measurements. University park press; 1977.
- [Google Scholar]
- Correlating Increased Ocular and Systemic blood Pressures with neuroretinal functions. Aviat Space Environ Med. 1996;67:1174-1178.
- [Google Scholar]
- Self-Tonometry Under Microgravity Conditions. Aviat Space Environ Med. 1995;66:568-570.
- [Google Scholar]
- An approach to the physiologic simulation of null gravity state. J. Av. Med. 1958;29:283-286.
- [Google Scholar]
- Physiological changes observed in human subjects during zero-g simulation by immersion upto neck level. Aerospace Med. 1961;32:1031-104.1.
- [Google Scholar]
- Possibility of long-term water immersion by the method of Dry Immersion. Kosm Biol Aviakosm Med. 1976;2:82-84.
- [Google Scholar]
- 1979: Comparison of Physiological effects of Head Down Tilt and Immersion on human body. Aviation Space Environ Med. 1979;50:1020-1022.
- [Google Scholar]
- The role of posture in the natriuresis of water immersion in normal man, Proc. Soc. Exptl Biol. Med. 1973;142:124-127.
- [Google Scholar]
- Effects of water immersion to the neck on pulmonary circulation and tissue volume in man. J Appl Physio. 1979;40(3):293-299.
- [Google Scholar]
- Simulation of spaceflight with whole-Body Head–Down Position; influence on intraocular pressure and retinocortical processing. Aviat, Space Environ. Med 1987(Suppl):A139-42.
- [Google Scholar]
- Intraclass Correlation, use in assessing later reliability. Psychological Bulletin. 1979;86:428-430.
- [Google Scholar]
- Intraocular pressure, retinal vascular, and visual acuity changes during 48 hours of 10 Head Down Tilt. Aviat Space Environ. Med. 1990;61:810-13.
- [Google Scholar]
- Physiological responses to prolonged bed rest and fluid immersion in humans. J. Appl. Physiol.: Respirat. Environ. Exercise Physiol. 1984;57(3):619-633.
- [Google Scholar]
- Impedance Cardiography. In: John G Webster, ed. Encyclopaedia of Medical Devices and Instrumentation. New York: Wiles;
- [Google Scholar]


