Translate this page into:
Evaluation of Optalert®Eagle Drowsiness Monitoring System in Non-aircrew Subjects
Abstract
Background:
Pilot impairment due to drowsiness and fatigue is a major contributing factor in aviation accidents world over. There has been a keen interest in developing a system that can monitor and quantify drowsiness, as well as provide a real-time warning to the operator. Optalert® Eagle Drowsiness Monitoring system in an unobtrusive method to evaluate the level of drowsiness and provides a real time score of the same.
Aim and objectives:
To evaluate the Optalert® Eagle Drowsiness Monitoring system as a tool for assessment of fatigue due to sleep loss.
Methodology:
The study subjected 12 volunteers to sleep loss of two different durations and analysed the effects of sleep loss using the John’s Drowsiness Scale (JDS) derived from Optalert® Eagle Drowsiness Monitoring system, the Reaction Time using the Psychomoter Visual Tracking (PVT) and the Sleepiness score from Stanford Sleepiness Scale (SSS).
Results:
The subjective drowsiness arising in a “2 hours sleep loss followed by a period of restful sleep” was not detected by by Optalert® Eagle Drowsiness Monitoring system. However, the system detected the drowsiness arising after “20 hours of continuous wakefulness”. The onset of performance decrement and subjective feeling of sleepiness is corroborated by the PVT and the SSS scores.
Conclusion:
The Optalert® Eagle Drowsiness Monitoring system is an objective measure for detecting drowsiness. The increase in scores correlates well with other objective and subjective criteria. It is a non-intrusive measure for detecting drowsiness and therefore can be used in operational scenarios after field trials.
Keywords
Optalert® Eagle Drowsiness Monitoring system
Sleep loss
PVT

Introduction
An aircraft cockpit is a workspace that demands the highest level of cognitive functioning from its operator i.e. the aircrew. Fatigue or drowsiness leading to a decrement in the cognitive skills of the aircrew can have disastrous consequences in terms of men and material [1–3]. Therefore, aircrew alertness before and during a sortie is of utmost importance. Efforts have been there to develop a system which can monitor and quantify the drowsiness, as well as provide a real-time warning to the operators.
Review of Literature
There is a long-standing debate over what measure to use to detect the effects of sleep loss in a viable and simple way that is neither expensive nor time-consuming. Performance tasks have been used as a surrogate measure of sleepiness and fatigue. Decrement in performance is attributed to fatigue as a result of sleep loss [4]. Restricted sleep time affects different aspects of waking cognitive performance, especially alertness. Performance on psychomotor vigilance tasks requiring vigilant attention is very sensitive to sleep loss in general and sleep restriction in particular. The Indian Air force has undertaken trials on pharmacological measures to mitigate sleepiness and maintain performance of the aircrew [5]. Many experiments have demonstrated that sleep deprivation increases behavioural lapses during performance, which are attributed to microsleeps. Though cognitive performance decrement is not a direct measure of sleepiness, the external validity of this effect is high in terms of real world consequences. However, under laboratory conditions, performing a test battery (performance test) is known to contaminate the results due to arousal [6].
An alternative to performance test is to measure subjective sleepiness. Subjective sleepiness responses during chronic sleep restriction show a different dynamic profile than those found for acute total sleep deprivation. While the latter results in immediate increases in feelings of sleepiness, fatigue and cognitive confusion, with concomitant decreases in vigor and alertness, chronic sleep restriction yields much smaller changes in these psychometric ratings of internal state [7]. Another way to detect sleepiness is to use objective measures directed at the individual to detect changes in physiological states that indicate sleepiness. In the Operated-centered approach, data is collected from the operator before and after the operational performance. The technologies which are used are as follows:-
“Bio-mathematical models” based on circadian cycles and various homeostatic sleep/wake timing factors.
“Fitness-for-duty tests” that use assessments of pre-task performance and/or physiological state to assess readiness to perform a task.
“Online monitoring technologies” involving dynamic acquisition and processing of human data during an operational performance across the time intervals.
Of these subtypes, the first two are not designed for detecting or predicting real-time changes in alertness, fatigue, or fatigue-related risk but provide longer-term predictive approaches on time scales ranging from hours to days. The third type of operator-centered method provides online fatigue or fatigue-related performance estimates that are updated at regular time intervals (seconds to tens of minutes). Because the online approaches enable acquisition and processing of human-generated data from one or more sensors during operational performance, they can be used to detect or predict immediate or impending levels of risk. Eye movements and eye closures have been studied during sleep loss protocols, under the premise that increases in the number and duration of slow eye movements and slow eyelid closures are the reflections of increased sleep tendency. It has been demonstrated experimentally that slow eyelid closures during performance demands reliably track lapses of attention on a vigilance task and during simulated driving [7,8]. Defense Institute of Physiology & Allied Sciences (DIPAS) in collaboration with IIT(Kharagpur) and the Institute of Aerospace Medicine, IAF is evaluating a Fatigue Monitoring System which uses an algorithm based on Eye tracking and Reaction time to determine fitness to fly in fatigued aircrew. This study was undertaken to study the employability of a similar system (Optalert® Eagle Drowsiness Monitoring system) to measure drowsiness in an experimental setting before using it in the field (flying squadrons).
Aim
To assess the capability of the Optalert® Eagle Drowsiness Monitoring system as an objective measure of drowsiness.
Objectives
The study had the following objectives:-
Evaluation of the Optalert® Eagle Drowsiness Monitoring system as a tool for assessment of fatigue due to sleep loss.
Validation of the Optalert® Eagle Drowsiness Monitoring system as a tool for assessment drowsiness due to sleep loss against established standards of Stanford Sleepiness Scale (SSS) and Psychomotor Vigilance Test (PVT).
Methodology
Subjects. The subject population consisted of matched 12 non-aircrew volunteers of similar age, educational experience and lifestyle.
Experiment Design. Repeated measure design with each ‘case’ serving as his/her own ‘control’ was used.
Equipment. The following equipment were used during the conduct of the study:-
National Sleep Foundation Sleep diary. It is a diary comprising of questions related to the sleep-wake schedule of the subjects.
Groningen Sleep Quality Scale (GSQS).
Optalert® Eagle Drowsiness Monitoring System. Optalert® Eagle Drowsiness Monitoring system was developed by Optalert, Australia. It uses an infra red camera to capture the velocity and amplitude of the blinking of the upper eyelid (levator palpebrae superioris). Using a proprietary formula, the equipment calculates and provides a score called John’s Drowsiness Score (JDS) [9]. The John’s Drowsiness scale score uses a weighted combination of ocular variables to calculate a drowsiness score on a scale of 1 to 10 as shown in Figure 1.
Psychomotor Vigilance Task (PVT) equipment. This gives the simple reaction time to a visual stimulus in milliseconds.
Stanford Sleepiness Scale (SSS) questionnaire consist of eight questions scored on a 7 point scale. A score of 4 or more on any of the questions indicates sleepiness.

- Johns Drowsiness Score
Protocol. The experiment had two test protocols:-
Studying the effects of 2 hours of sleep deprivation
Studying the effects of 24 hours of continuous wakefulness.
Institute Ethical Committee clearance was obtained for the experiment carried out on human subjects involving sleep deprivation.
Methodology
The volunteers were subjected to the experiment protocol as per the details given below:-
Each subject was provided with the National Sleep Foundation sleep diary to fill up daily, five days prior to the study. This was scrutinised by the researcher every day morning. One day prior to the study, all the participants were briefed regarding the protocol and the significance of the study. A written, informed consent was obtained. All subjects were instructed to sleep according to their regular sleep wake schedule on that night.
On Day-1, the subjects reported for testing at 0730 hours after a normal night’s sleep. They filled up the Groningen Sleep Quality Scale (GSQS). The sleep diary was collected and a sleep history for the previous night was recorded.
Concurrently, each subject wore the Optalert® Eagle Drowsiness Monitoring system (Figure 3). The equipment was adjusted for optimum reading. The JDS over a 10 minute period was manually recorded from the portable display every 30 sec (Figure 2). The subjects filled up the SSS and performed the PVT during this period. This data was taken as the baseline data for the subject.
-
Protocol for “2 hours Sleep Deprivation Group”
Six volunteers participated in this cohort. The subjects in the 2 hours sleep deprivation group were instructed to sleep two hours later than their regular sleeping time (as derived from the sleep diary) that night, thereby enforcing them to 2 hours of sleep deprivation. They were woken up at their normal time of awakening as per the sleep diary. They were allowed a 30 min period for morning ablutions and to allow for sleep inertia period to pass. They then filled up the Groningen Sleep Quality Scale (GSQS). Concurrently, each subject wore the Optalert® Eagle Drowsiness Monitoring system. The equipment was adjusted for optimum reading. The JDS over a 10-minute period was manually recorded from the portable display every 30 sec. The subjects filled up the SSS and perform the PVT during this period.
-
Protocol for “24 hours Continuous Wakefulness Group”
Six volunteers participated in this cohort. The subjects of this group were kept awake one full night and starting at 2000h. Their drowsiness state was monitored every two hours with the Optalert® Eagle Drowsiness Monitoring system. The JDS over a 10 minute period was manually recorded from the portable display every 30 sec. The subjects filled up the SSS and performed the PVT during this period of wakefulness
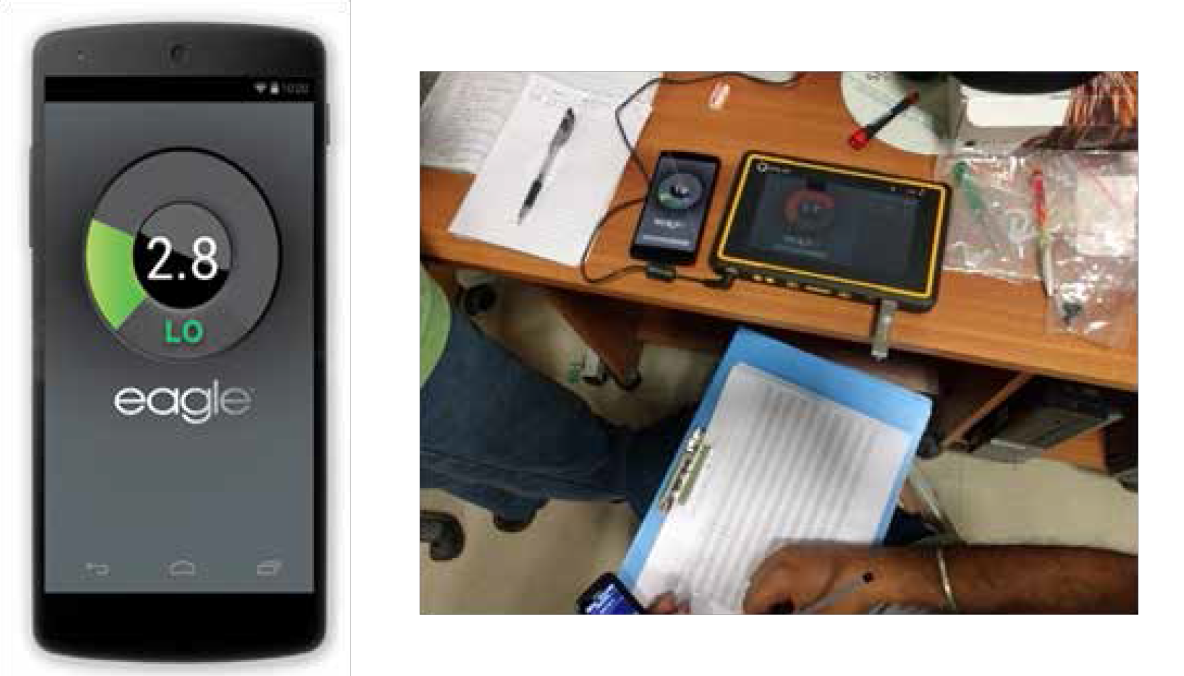
- Portable monitor showing the Johns Drowsiness Score
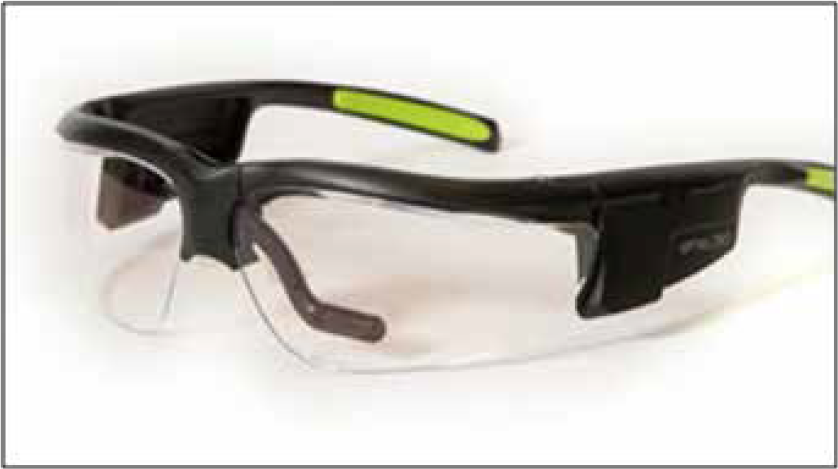
- Frame mounted with infrared camera
Statistical analysis. The descriptive statistics for all three parameters was tabulated. For each score, the parameters were analysed across time using ANOVA. A correlation analysis was done between the three variables.
Results
The mean age of the subjects (n=12) was 32.4 (±3.2) yrs. Six participants took part in each of the two cohorts.
The Groningen sleep Quality score had a mean of 9.3 (±3.1) out of a maximum possible score of 14 on the morning of the study.
Two Hours Sleep Loss
The JDS for the two hours sleep loss group was compared with the baseline. No significant difference between the two scores could be found. None of the participants showed a score above the cutoff value of 4.5 (Medium risk) in the next day morning. The SSS for the two hour sleep loss when compared with baseline showed a statistically significant mean difference of 1.5 (p=0.003). The PVT scores of the post exposure readings could not be retrieved and hence were not analysed.
24 Hours Continuous Wakefulness
Descriptive statistics of JDS (Table 1)(Figure 4) shows the increasing trend of drowsiness over time.
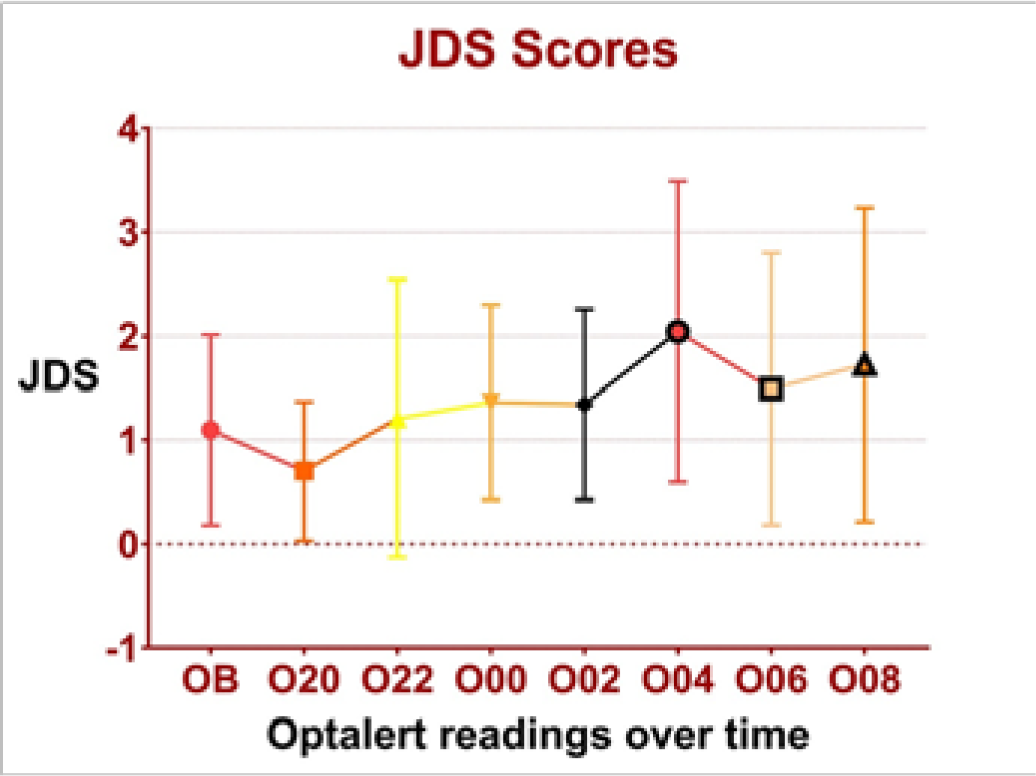
- Mean and SD of JDS over time.
| Baseline | 2000h | 2200h | 0000h | 0200h | 0400h | 0600h | 0800h | |
|---|---|---|---|---|---|---|---|---|
| Mean | 1.8 | 1.4 | 1.9 | 1.8 | 1.9 | 2.6 | 2.1 | 2.3 |
| Std. Deviation | 1.7 | 1.8 | 1.9 | 1.4 | 1.6 | 1.8 | 1.9 | 2 |
| Minimum | 0 | 0 | 0 | 0 | 0.1 | 0 | 0 | 0 |
| Maximum | 5.7 | 5.7 | 5.9 | 4.8 | 5.8 | 6 | 6.5 | 6.6 |
ANOVA of the JDS over time showed a significant effect of the continuous wakefulness (F=14,p<0.0001). The post-hoc analysis of comparison between baseline and different periods of wakefulness is shown in Table 2.
| Dunnett’s multiple comparisons test | Mean Diff. | 95.00% CI of diff. | Adjusted P Value | Summary |
|---|---|---|---|---|
| Baseline vs. 2000h | 0.33 | 0.16 to 0.5 | 0.0001 | **** |
| Baseline vs. 2200h | -0.11 | -0.41 to 0.18 | 0.8436 | ns |
| Baseline vs. 0000h | -0.072 | -0.38 to 0.24 | 0.9860 | ns |
| Baseline vs. 0200h | -0.16 | -0.45 to 0.13 | 0.5386 | ns |
| Baseline vs. 0400h | -0.82 | -1.3 to -0.34 | 0.0001 | **** |
| Baseline vs. 0600h | -0.38 | -0.69 to -0.065 | 0.0104 | * |
| Baseline vs. 0800h | -0.57 | -0.94 to -0.19 | 0.0007 | *** |
Descriptive statistics of PVT scores (Table 3) (Figure 5) shows the increasing trend of reaction time.
| Baseline | 2000h | 2200h | 0000h | 0200h | 0400h | 0600h | 0800h | |
|---|---|---|---|---|---|---|---|---|
| Mean | 279 | 264 | 259 | 275 | 284 | 317 | 325 | 302 |
| Std. Deviation | 132 | 76 | 90 | 86 | 99 | 159 | 171 | 182 |
| Minimum | 1 | 1 | 1 | 1 | 1 | 1 | 1 | 0 |
| Maximum | 1833 | 607 | 942 | 972 | 1075 | 1497 | 1619 | 1951 |
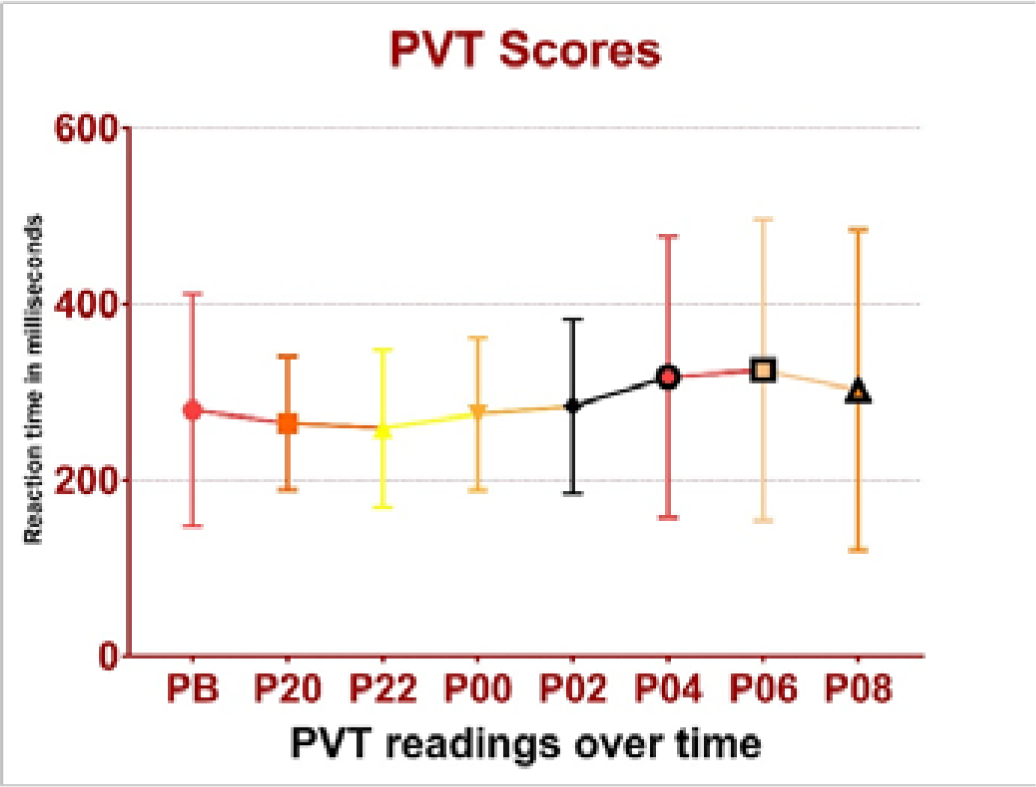
- Mean and SD of PVT over time.
ANOVA of the PVT scores over time showed a significant effect of the continuous wakefulness (F=19, p<0.0001). The post-hoc analysis of comparison between baseline and different periods of wakefulness is shown in Table 4.
| Dunnett’s multiple comparisons test | Mean Diff. | 95.00% CI of diff. | Adjusted P Value | Summary |
|---|---|---|---|---|
| Baseline vs. 2000h | 15 | -5.6 to 35 | 0.2576 | ns |
| Baseline vs. 2200h | 21 | 0.33 to 41 | 0.0446 | * |
| Baseline vs. 0000h | 4.5 | -16 to 25 | 0.9914 | ns |
| Baseline vs. 0200h | -4.5 | -25 to 16 | 0.9917 | ns |
| Baseline vs. 0400h | -38 | -58 to -17 | 0.0001 | **** |
| Baseline vs. 0600h | -46 | -66 to -25 | 0.0001 | **** |
| Baseline vs. 0800h | -23 | -43 to -2.1 | 0.0233 | * |
Descriptive statistics of Stanford Sleepiness Scale scores (Table 5) (Figure 6) shows the increasing trend of perceived sleepiness over time.
| Baseline | 2000h | 2200h | 0000h | 0200h | 0400h | 0600h | 0800h | |
|---|---|---|---|---|---|---|---|---|
| Mean | 1.5 | 2 | 2 | 2.2 | 3.2 | 3.8 | 5.2 | 4.7 |
| Std. Deviation | 0.55 | 0 | 0 | 0.41 | 0.75 | 0.41 | 0.41 | 1.5 |
| Minimum | 1 | 2 | 2 | 2 | 2 | 3 | 5 | 2 |
| Maximum | 2 | 2 | 2 | 3 | 4 | 4 | 6 | 6 |
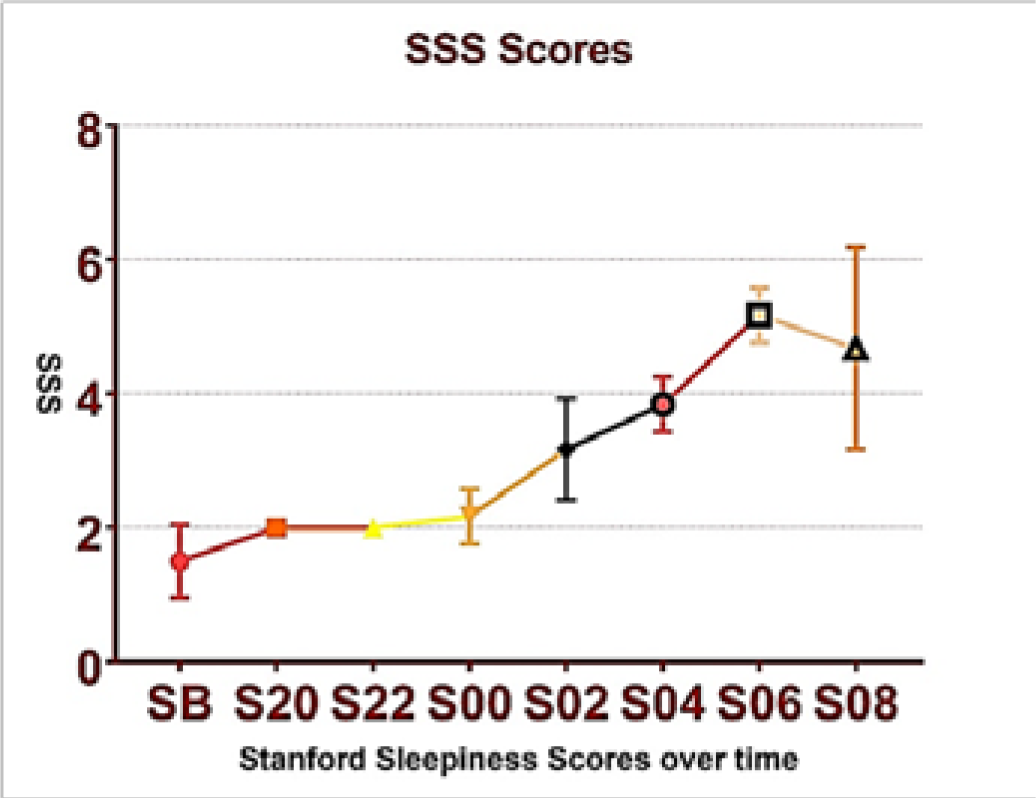
- Mean and SD of SSS over time
ANOVA of the Stanford Sleepiness Scale scores over time showed a significant effect of the continuous wakefulness (F=25, p<0.0001). The post-hoc analysis of comparison between baseline and different periods of wakefulness is shown in Table 6.
| Dunnett’s multiple comparisons test | Mean Diff. | 95.00% CI of diff. | Adjusted P Value | Summary |
|---|---|---|---|---|
| Baseline vs. 2000h | -0.5 | -1.6 to 0.56 | 0.6684 | ns |
| Baseline vs. 2200h | -0.5 | -1.6 to 0.56 | 0.6684 | ns |
| Baseline vs. 0000h | -0.67 | -1.7 to 0.4 | 0.3780 | ns |
| Baseline vs. 0200h | -1.7 | -2.7 to -0.6 | 0.0007 | *** |
| Baseline vs. 0400h | -2.3 | -3.4 to -1.3 | 0.0001 | **** |
| Baseline vs. 0600h | -3.7 | -4.7 to -2.6 | 0.0001 | **** |
| Baseline vs. 0800h | -3.2 | -4.2 to -2.1 | 0.0001 | **** |
A correlation analysis was carried out for all three variables measuring the effects of continuous wakefulness. The results are shown in Table 7.
| Optalert® scores | PVT Scores | |
|---|---|---|
| Optalert® scores | ||
| PVT Scores | r=0.775, p=0.02 | |
| Stanford Sleepiness Scale scores | r=0.679, p=0.06 | r=0.878, p=0.004 |
| Optalert® JDS | PVT scores | Stanford Sleepiness scale | |
|---|---|---|---|
| Baseline vs. 2000h | **** | ns | ns |
| Baseline vs. 2200h | ns | * | ns |
| Baseline vs. 0000h | ns | ns | ns |
| Baseline vs. 0200h | ns | ns | *** |
| Baseline vs. 0400h | **** | **** | **** |
| Baseline vs. 0600h | * | **** | **** |
| Baseline vs. 0800h | *** | * | **** |
ns= no statistically significant difference.
Discussion
Background of Study
Whether it is civil or military, there is a big “No” for drowsiness in aviation. Therefore, drowsiness detection is of paramount in this occupation. Moreover, in military flying, the concepts of sustained ops and continuous ops necessitate development of mechanisms to identify drowsiness in the aircrew. Self-reporting measures have long been used in this regard as they have high face validity and ultimately, drowsiness is a subjective feeling. However, the subjectivity of such systems makes them prone to human error. Therefore, the research into non-intrusive monitoring systems which can detect drowsiness has gained importance in the recent years.
Drowsiness Detection Methods
The non-intrusive drowsiness detection methods can have two major approaches. Video recognition techniques using camera images have been used widely. These methods analyse images captured by cameras to detect physical changes in operators, such as yawning, head nodding, eyelid movement and eye gaze. The other method is the non-intrusive biomedical signal measurement method. In this, biomedical signals can give significant information about various health parameters in addition to fatigue and drowsiness. However, wearing of transducers with wires and batteries makes them cumbersome [7].
Recently, the eyelid monitoring method using cameras has gained the attention of researchers because the system is fairly non-obtrusive. Optalert® Eagle Drowsiness Monitoring system, which is a similar system uses an infrared camera to capture the velocity and amplitude of the blinking of the upper eyelid (levator palpebrae superioris). This system uses a thin spectacle like frame with an infrared LED and a camera mounted on it. Using a proprietary formula, the equipment calculates John’s Drowsiness Score.
Scope of Study
The primary aim was to evaluate if the Optalert® Eagle Drowsiness Monitoring system can detect a change in drowsiness state of an individual accurately. With this aim, the Optalert® Eagle Drowsiness Monitoring system was evaluated against a performance measure i.e. Psychomotor Vigilance Task which measures reaction time during a vigilance task. The PVT has a large body of literature available that supports its ability to detect early signs of fatigue and consequent performance decrement. Apart from that, a subjective rating questionnaire, the Stanford Sleepiness Scale was also used for evaluating drowsiness. This subjective feeling was evaluated against the measured JDS scores.
2 hours Sleep Loss
The first cohort in this study had exposed the subjects (n=6) to 2 hours of sleep deprivation. The results show that Optalert® Eagle Drowsiness Monitoring system detected no change in the JDS the next day morning. In this protocol of 2 hours sleep loss followed by a restful sleep, the Optalert® Eagle Drowsiness Monitoring system could not detect the sleepiness. However, there was a subjective feeling of sleepiness which was reflected in the mean difference in SSS scores in the next day morning.
24 hours Continuous Wakefulness
The second cohort had exposed the subjects (n = 6) to 24 hours of continuous wakefulness and their parameters were recorded every two hours starting at 2000h. These values were compared against the baseline values. For all three parameters of JDS scores, PVT scores, SSS scores, the graphs of the means show a clear trend towards increasing drowsiness and performance decrement as the period of wakefulness increased. This visual impression is confirmed by the results of ANOVA which show that for all three parameters, there is a change in mean scores as the period of wakefulness increases. On post-hoc analysis, it was found that at 0400h, 0600h and 0800h all three parameters showed a statistically significant changes from baseline towards increasing drowsiness and performance decrement. Additionally, PVT showed a performance decrement at 2200h and SSS showed an increased sleepiness at 0200h. JDS did not show increased drowsiness at both these times. Based on the findings of this study, it can be concluded that JDS would detect drowsiness after 22 hrs of wakefulness.
Interestingly, both JDS and PVT showed a lesser score on drowsiness at 2000h as compared to the baseline (more alert at 2000h than baseline). This is not corroborated by the subjective rating. This can be attributed to an enhanced state of arousal at the first readings of the evening and to the arousal phase of the circadian rhythm at 2000h.
Correlation between JDS, PVT and SSS
There is a high degree of positive correlation of the JDS scores with both PVT scores and SSS scores. A study of the mean difference in scores however reveals that there is very little difference between all three scores till 0400h. Therefore, it can be inferred that in this type of study setting, even with a larger study population, the findings would have been similar. On the other hand, it also indicates that an experimental setting which brings a change in PVT performance is also likely to be reflected in the Optalert system scores.
John’s Drowsiness Scale
As per the provided literature from the OEM, the JDS™ is a composite scale based on weighted values of many different variables reflecting the short-term variability of blinks and eyelid closures, duration and velocity characteristics, measured each minute. This weighted combination of ocular parameters provides a single, sensitive measure of dynamic alterations in alertness and drowsiness and does not require adjustment for individuals. The JDS™ is a 10-point scale; a score of 0 = ‘very alert’ and 10 = ‘very drowsy’.
In this study, it was seen that the JDS varied widely between individuals at all points in time. It is also evident from the examination of raw data that some subjects have a consistently higher or lower JDS score irrespective of their duration of sleep deprivation. This implies that individual change in JDS by certain amount may be a more sensitive indicator of the level of drowsiness in individuals.
A JDS of ‘4’ has been categorized as medium risk as per the OEM. In this study, the mean JDS score was never found to be greater than 4 at any period of sleep deprivation. The mean JDS was 2.6 (S.D=1.8) at 0400h. A z score calculated for the value of JDS = 4 was 0.7. In other words, a JDS of 4 lies 0.7 S.D. away from the mean. Converting this into percentage probabilities, there are about 25% of values are above the value of 4.
Summary and Conclusion
The Optalert® Eagle Drowsiness Monitoring system was evaluated against an objective measure (Psychomotor Vigilance Task) and a subjective measure (Stanford Sleepiness Scale). The following findings can be summarized from the study:-
The Optalert® Eagle Drowsiness Monitoring system does not appear to detect any drowsiness due to 2 hrs sleep loss when it is followed by a period of restful sleep.
The Optalert® Eagle Drowsiness Monitoring system detects drowsiness reliably beyond 20 hrs of continuous wakefulness. This drowsiness is accompanied with onset of performance decrement and subjective feeling of sleepiness as found by the PVT and the SSS scores respectively.
The increase in John’s Drowsiness Score correlated well with other objective and subjective measures.
The John’s Drowsiness Scale scores were found to be above a cutoff value of medium risk in approximately 25% of the subjects after 20 hrs of continuous wakefulness. This may indicate that individual change in scores may be a more sensitive measure of onset of drowsiness rather than preprogrammed across-the-board warnings by the instrument.
Recommendations
The Optalert® Eagle Drowsiness Monitoring system provides an objective measure of the onset of the drowsiness. The increase in scores correlates well with other objective and subjective criteria. It is a non-intrusive measure of detecting drowsiness and therefore can be used in operational scenarios. It is unlikely to detect small amounts of sleep deprivation of (up to 2 hours) if it is followed by a period of restful sleep. Hence, it may not be useful as a routine preflight screening tool for detecting drowsiness. However it is sensitive enough to detect drowsiness induced by periods of continuous wakefulness beyond 20 hours. A larger well controlled trial may reveal the capability of the instrument to detect drowsiness of lower levels resulted from lesser periods of wakefulness.
By definition, continuous operations extend beyond 72 hours but do not necessarily require longer hours worked per individual, whereas sustained operations involve individual continuous performance longer than 72 hours, usually until goal attainment. Therefore, Optalert® Eagle Drowsiness Monitoring system could be useful tool in identifying operators (aircrew) whose performance is likely to decrease due to sustained ops.
References
- Effect of cumulative sleep loss on susceptibility to spatial disorientation. Ind J Aerosp Med. 2009;53(2):17-26.
- [Google Scholar]
- Sustained Work, fatigue, sleep loss and performance: A review of the issues In: USAARL Report No. 89-22. 1989.
- [Google Scholar]
- Fatigue and Duty Time Limitations - An International Review. Conference Proceedings. The Royal Aeronautical Society.
- The cumulative cost of additional wakefulness: dose-response effects on neurobehavioral functions and sleep physiology from chronic sleep restriction and total sleep deprivation. Sleep. 2003;26(2):117-26.
- [Google Scholar]
- Maintenance of mental alertness during total sleep deprivation of short duration: A double blind, placebo controlled, comparative study between Modafinil 100 mg and 200 mg IJASM. . 2015;59(1):1-6.
- [Google Scholar]
- Behavioral and physiological consequences of sleep restriction. J Clin Sleep Med [Internet]. 2007;3(5):519-28. Available from: http://www.ncbi.nlm.nih.gov/pubmed/17803017%5Cnhttp://www.pubmedcentral.nih.gov/articlerender.fcgi?artid=PMC1978335
- [Google Scholar]
- Review of Fatigue Management Technologies for Enhanced Military Vehicle Safety and Performance. Technical Report. U.S. Army Research Laboratory;
- [Google Scholar]
- Development and Assessment of a Driver Drowsiness Monitoring System [Washington]: US Department of Transportation,Federal Motor Carrier Safety Administration,Office of Analysis, Research and Technology; 2012.
- [Google Scholar]
- Detecting sleepiness by Optalert Final report In: Virtual Prototyping and Assessment by Simulation. [Linköping Sweden]: Swedish National Road and Transport Research Institute; 2010.
- [Google Scholar]


