Translate this page into:
Development of Data Acquisition System for Heat Strain
Abstract
With the introduction of today’s high performance aircraft and the spacecrafts, the problem of a valid method for selection of candidates, best suited to work in hot environment, is becoming increasingly important. At present no readymade system is available to study the heat strain responses on exposure to heat stress. Keeping the present technology in mind in the field of hardware and software, it was decided to develop a microprocessor based system for on line acquisition, analysis and storage of heat strain parameters along with the heat stress parameters, during the conduct of heat tolerance test. Heat stress data from hot cockpit was derived through thermistor probe and specially designed software based on Turbo C and Microsoft Assembler Language (MASM). Heat strain data were obtained from specially procured equipment in the form of intelligent Satellite unit (ISU) for the measurement of oral and skin temperatures, Weitek electronic weighing scale for sweat loss measurement and Cardiart EKG machine from BPL for heart rate and specially designed software based on Turbo C and MASM Language. All the above equipment were connected through a multiplexer to a computer. A software program with the help of Visual Basic Version 6, Turbo C language and Microsoft Excel was developed in the name of DATA ACQUISITION software ( DA Software) for on line acquisition, analysis and storage of heat stress and heat strain parameters and their automatic analysis for reporting on the test. A combination of Hot Cockpit, ISU, EKG machine, Weitek weighing scale, multiplexer, computer and DA software is known as Data Acquisition system for heat strain. It helps in precise assessment of heat stress to which subject has been exposed to during the experiment and assessment of heat strain responses in the subject during experimentation. The system also helps in online derivation of all the relevant heat strain indices, storage of data and generating the report based on the current test or even generating the report from the previously conducted test It helps in the assessment of heat tolerance of the aircrew reporting for final fitness for flying after temporary unfitness. It will also help in the assessment of heat tolerance as part of initial medical examination for the aircrew/space crew, if a need arises in future.
Keywords
Wet bulb globe temperature
Heat stress
Heat strain
WBGT

Heat stress remains one of the major stresses of military flying. Heat stress in an aircrew gains major importance particularly during hot weather conditions in India, specially while flying helicopter, Mig-21, Mig-27 and ISKARA aircraft in a low level sonie (1,2). With the introduction of high performance aircraft and the spacecrafts, the problem of a valid method for selection of better candidates best suitable in the hot environment is becoming increasingly important. At present no uniform system exists for evaluating the heat strain reponses in candidates. As on today subjects reporting for heat strain studies are evaluated by subjecting them to non-standardised simulated hot environment in the hot cockpit and manually noting down their responses in the form of increase in heart rate, sweat rate, body temperature and calculating various kinds of complicated heat strain indices with the help of calculator. Although the subjects are declared fit/unfit based upon the above responses but practically it is too time consuming to derive various heat strain indices and there are high chances of incomplete assessment also. The problem becomes further compounded, when these records are required to be maintained for further analysis in future and formulate the policy to reduce heat related casualties in the personnel operating during hot weather. It has been observed that evaluation of heat stress response involves collection of at least 10 raw parameters (Table I) during the heat stress run and derivation of about 15 calculated parameters (Table II) from the above raw parameters to reach to a conclusion. Keeping the present technology in mind in the field of hardware and software, it was decided to develop a Microprocessor based system for on line acquisition, analysis and storage of heat strain parameters along with the heat stress parameters.
| Field Number | Field Caption | Field Name |
|---|---|---|
| 1 | Tdb | Temperature Dry Bulb thermometer |
| 2. | Twb | Temperature Wet Bulb thermometer |
| 3. | Tbg | Temperature Black Globe thermometer |
| 4. | H. Rate | Heart Rate |
| 5. | T1 (Oral) | Oral temperature |
| 6. | T2 (Chest) | Skin temperature from chest |
| 7. | T3 (Arm) | Skin temperature from arm |
| 8. | T4(Thigh) | Skin temperature from thigh |
| 9. | T5 (Leg) | Skin temperature from leg |
| 10. | Body. Wt | Body weight to give idea about sweat loss |
| Field Number | Field Caption | Field Name |
|---|---|---|
| 1 | MST | Mean Skin Temperature |
| 2 | MBT | Mean Body Temperature |
| 3 | Body Heat Content | Body Heat Content |
| 4 | Delta H. Rate | Change in Heart Rate as compared to Pre-Exposure |
| 5 | Sweat Rate | Sweat Rate |
| 6 | DeltaOral | Change in Oral Temperature as compared to Pre-Exposure |
| 7 | DeltaMST | Change in MST as compared to Pre-Exposure |
| 8 | DeltaMBT | Change in MBT as compared to Pre-Exposure |
| 9 | PSI | Physiological Strain Index |
| 10 | HAI | Heat Accumulation Index |
| 11 | Cl | Modified Craig’s Index |
| 12 | ACS | Accumulative Circulatory Strain |
| 13 | WBGT | Wet Bulb Globe Temperature Index |
| 14 | Oxford Index | Oxford Index |
| 15 | MDI | Modified Discomfort Index |
Methods
Evaluation of heat tolerance test in human being needs the assessment of
Heat stress of the simulated hot environment to which subject is exposed to.
Physiological changes in the subject, at regular intervals (viz at every 5 min for 1 hour) during heat exposure.
Assessment of heat stress from the Hot Cockpit Wet bulb globe temperature index (WBGT) is now a widely accepted index of heat stress (3,4). Its derivation is based on the recording of temperature dry bulb (Tdb), temperature wet bulb (Twb) and temperature of black globe (Tbg) thermometers. Hot Cockpit available in our laboratory, when set to attain a particular level of heat stress and maintain it, has been found to have a small fluctuation from the set level of heat stress. It is not a fault in the system, as any system based on the negative feed back from the sensors is expected to fluctuate around the set point of the system. But during the heat stress evaluation, it will be of more significance to have a correct level of heat stress to which a subject has been exposed to rather than taking the set point of the system for which hot cockpit was set, for precise evaluation of heat strain response. It was, therefore, decided to measure Tdb, Twb and Tbg from the hot cockpit at regular intervals to get an idea of mean heat stress to which the subject is exposed to during the test (4).
Simulated hot environment in the Hot Cockpit was controlled and maintained by the HCS software (supplied by Numag Data Systems Pvt Ltd, Bangalore). It is a PC based integrated system based on obtaining data of Tdb, Twb, and Tbg with the help of thermistor and controlling hot environment in the hot cockpit with the help of software written in Turbo C and Microsoft Assembler (MASM) languate (1). It provided details of the heat stress parameters through RS232 to a multiplexer.
Assessment of heat strain responses from human subjects during test
Evaluation of heat strain response needs the measurement of heart rate (HR); mean skin temperature (MST) by recording skin temperatures from chest, arm. thigh and leg; core temperature/oral temperature; mean body temperature (MBT); sweat production and sweat evaporation by measuring body weight and changes in it during heat exposure (5,6). It was considered essential to procure and use only those equipments for measuring above parameters, which can communicate to microprocessor or personal computer (PC) through RS 232 port. The Heat Strain Data were collected through several individual instruments.
Body Temperature. Body temperature data from various places of body viz skin temperature from chest, upper arm, thigh and leg and oral temperature were obtained through RTD sensors connected to Intelligent Satellite Unit Model - CS 7562 - D (ISU) obtained from Century Systems, Bangalore. It is a 16 Channel temperature measuring machine, but only 5 channels from this equipment were utilised to get 4 skin and 1 oral temperature data from the subjects. This instrument does have the facility to provide data to external devices through RS232. The supplier of ISU provided the detail of command sequence to extract the data from this instrument.
Body Weight. Online body weight during experiment was collected and provided through the RS232 output of Electronic Weighing Scale CL 111 (EWS) obtained from WEITER, Bangalore. Its platform was kept under the seat in the hot cockpit to get weight of the subject during experiment for deriving amount of sweat evaporation at various time intervals during simulated heat stress exposure in the Hot Cockpit. This instrument also has the facility to provide data to external devices through RS232.
Heart Rate. HR data was collected through ECG electrode and ECG machine (CARDIART 308 ECG Machine from BPL), connected to the ND200 (Addon card to PC, supplied by Numag Data Systems Private Ltd). This device can filter the ECG data and derive the HR based on a program developed using Turbo C and MSAM language. This device needs one slot of ISA (Industrial System Architecture) typd on PC. It was plugged into the PC, which was used for the heat strain data analysis.
Development of Data Acquisition System Software (DA Software)
A Software program was written in Visual Basic version 6 and Turbo C language to meet all the requirement of Data Acquisition System and extracting data from various instruments used in the system.
Files for getting data from above mentioned devices
Following files were created in Turbo C language to get data from the above instruments.
Selchan.exe - Application file required to switch the multiplexer for tappaing data from different channels.
Hcstemp.exe - Application file gets the heat stress data from HCS.
Weight.exe - Application file gets the body weight data from EWS.
Scanpulug.exe - Application file gets the temperature data from ISU.
Iam4.exe - Application file gets the HR data from ECG machine.
Nd200n.d.ac - Used by Iam4.exe
Nd200.dat - Used by Iam4.exe.
Nd200.hrt-Usedbylam4.exe.
Nd200.dac-Usedbylam4.exe.
Multiplexer
SMX-421 Serial Multiplexer form Numag Data System, Bangalore, which can link up to 4 numbers of RS232 channels to a PC through a single COM port (RS232 channel) of PC, was used for connecting the above instruments to the system. ECG data was collected through ND200 add-on card, which was plugged into the ISA slot of the computer. Multiplexer switches between various channels during running of the test.
Meter Component
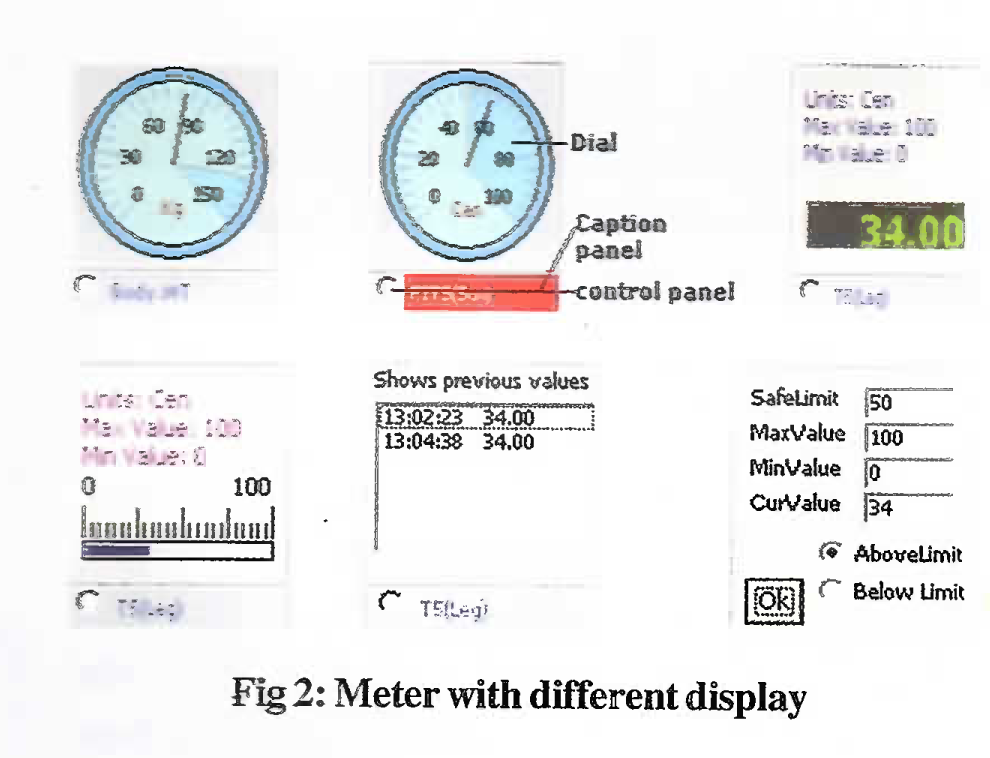
Special type of display component used in Data Acquisition was Meter components for all the heat stress and heat strain data (Fig 1)
The figure 2 shows a meter component in run time environment. This component basically displays the value of any field. It has a round panel in which ticks are marked from minimum possible value to maximum possible value. The unit (viz kg) representing the field is for the parameter shown in the bottom rectangular panel (viz body WT). The safe limit is marked with dark color, which is distinguishable. All these parameters can be changed through few key strokes and mouse clicks. If meter value crosses the safe limit assigned to it then lower rectangular panel will be painted with red colour to draw the users attention. After sometime, if meter value comes with in the safe limit again, then rectangular panel lying below will be painted with normal colour. Different format of the meter and meter setup screen can be changed by a round whitish control radio button on the left side of the rectangular panel.(Fig 2)
On pressing the button for the first time, a Meter with LCD type of display (digital) appears on the screen. In this screen maximum value and minimum value supported by the meter and units represented by field will be displayed along with current value.
On pressing the control button for the second time, a Meter with thermometer type of display is seen. In this screen maximum value and minimum value supported by the meter and units represented by field will be displayed along with current value. On pressing the control button for the second time, a Meter with thermometer type of display is seen. In this screen maximum value and minimum value supported by the meter and units represented by field will be displayed along with current value displayed in a thermoneter like display. On pressing the control button for the third time, a meter showing the previously recorded values is seen. The last display in the list will be currently updated value. The value will be shown along with system time at the time of making entry. On pressing the control button for the fourth time, a Meter-setup screen is seen. It displays the followings.
Safe Limit - It is the safe limit that the meter value can work with.
Max Value - It is the maximum value that meter can support.
MinValue - It is the minimum value that meter can support.
CurValue - It is the current value that meter is holding.
Two Radio buttons are shown below all these boxes. These buttons can be set to indicate to the meter, that Safe Limit lies above or below i.e. if it is Above Limit then meter takes it as value between safe limit value and maximum value is critical, and below which it is all right. If it is Below Limit then meter takes it as value between safe limit value and minimum value is critical and above which it is all right. Any value in these boxes can be changed. After the change of value, it is required to press OK to return to Main Screen i.e. Meter with display dial. It is to be noted that if current value is changed, it will not effect the test in anyway but changing other values will lead to some changes in the next refreshing cycle.

Meters for Heat Stress and heat Strain data
Meter with different display
Use of Referace Sheet or Template File
A file by name Refrence.xls (Fig 3) is available in application path (Application path is the folder in which DA Software is installed; viz c:\data\). DA Software makes use of Microsoft Excel Sheets for its operation for
Storing the subject’s bio-data
Storing the run time data collected from various devices
Calculation of various parameters collected during run time
Plotting graph for selected data from subject’s data table.
- Refrence .xls tile
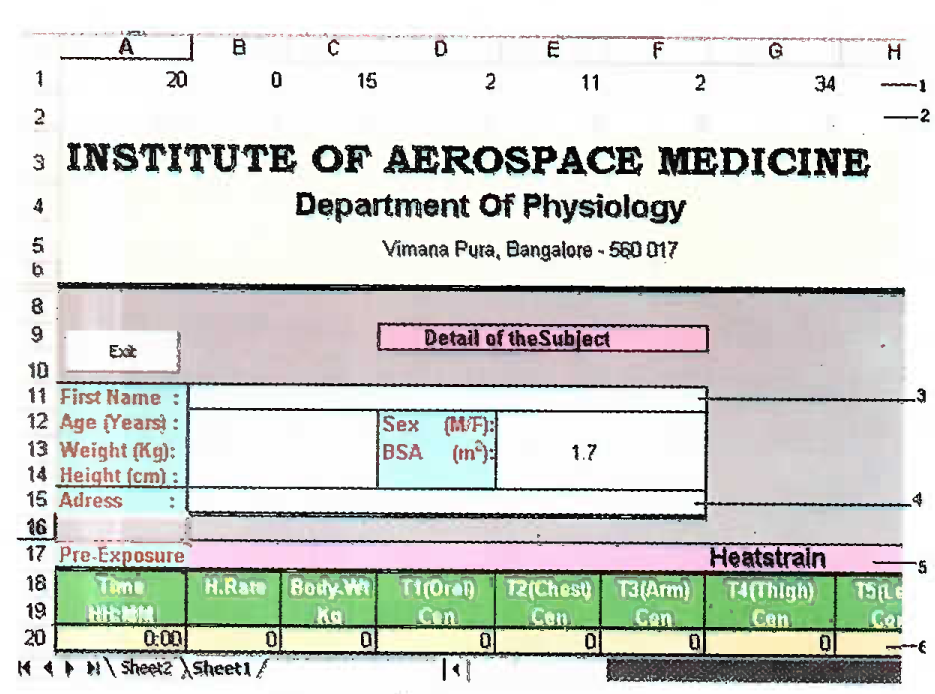
First row in the Template file : First row of the Refrence.xls is reserved for system usage. The information stored in this row in various columns is as follows.
-
Column 1. (with caption ‘A’): This column in first row gives the last free entry. That is last row number where current observation has stopped. The value in this column will be increased every time when observation is made during running of test on any subject. This should be increased or decreased manually by user only if last available row number changes after adding some rows in between.
The figure 3 shows that last available row is 20; therefore 20 is entered in first row first column of Template file.
Column 2. (with caption ‘B’): This column gives total number of tests done on current subject. This should be 0 in the Template file. The software will edit this column during start of the test for any subject. The user should not edit first row second column in the Template file manually.
Column 3. (with caption ‘C’): This column gives the number of rows used for bio-data from starting of the sheet. When user adds new field in the biodata (new row) then this number should be increased.
Column 4. (with caption ‘D’) : This column in first row gives number of rows available in the table header. Value of this column should always be 2.i.e first row in table gives caption of the field and second row in table gives the unit with which this field is measured.
Column 5. (with caption ‘E’) : This column in first row gives row number containing the ID number.
Column 6. (with caption ‘F’ ) : This column in first row gives column number containing the ID number. ID number is the data (value) with which subjects data file will be saved during the test. Here in above example it is first name of the subject. The value of 5th column in the Template file (Refrence.xls) is 11 and value in 6th column in the first row of Template file is 2. This means that data in this specified column and row will be taken for saving the subject’s data in “Repos” directory. If the ID is to be changed to the subject’s age (as name of the file) then change the value in 5th column 1st row of template file to 12. But the 6th column value will not be required a change.
Column 7. (with caption ‘G’) : This column in first row gives column number where table ends. Notice that if the last column is “AH” i.e equialent to 34. So 34 is entered in 7th column of the 1st row of Template file.
Column 8. (with caption ‘H’): This column in first row gives number of columns in the bio-data table.
Column 9. (with caption ‘I’): This column in first row gives row number from which bio data starts.
Second row in the template file Second row in the template file is also reserved. DA Software will use this row for storing values observed during Pre-exposure period. So this row should not be used for some other purpose.
Bio-data table Bio-data table stores the information about the subject. All the subject’s information is required to be entered for the first time. Any further changes in the information can be edited subsequently. Whenever any new row or column is added in the biodata table of Template file then 3rd, 8th and 9th column in the 1st row of Template file will need to be edited accordingly.
Subjects test Data table This table stores the subjects test Data during run time. The table will proceed (row will be increased) at specified interval (can be set through software). Time at which the current observation was made will be stored in the first column of the table. This first column is constant and should not be modified by user. The other columns can store either raw values (Table I) or calculated values (Table II) in them. First row will hold the caption of the various fields. Second row will have units for field representing particular column. The Caption Raw data columns are constant. The names for columns used as constant for the raw data in software are as given in Table I.
For calculated values (Table II), which depend on the values in the raw data columns, the relevant formulas (7, 8, 9) can be entered in the row provided for that For calculated columns, although any name can be given,, but Meters in Meters panel ma)’ show’ these calculated columns as disabled. If any column is added or removed, then value of 7th column in the reserved 1st row of Template file will need to be changed.
Set up screen
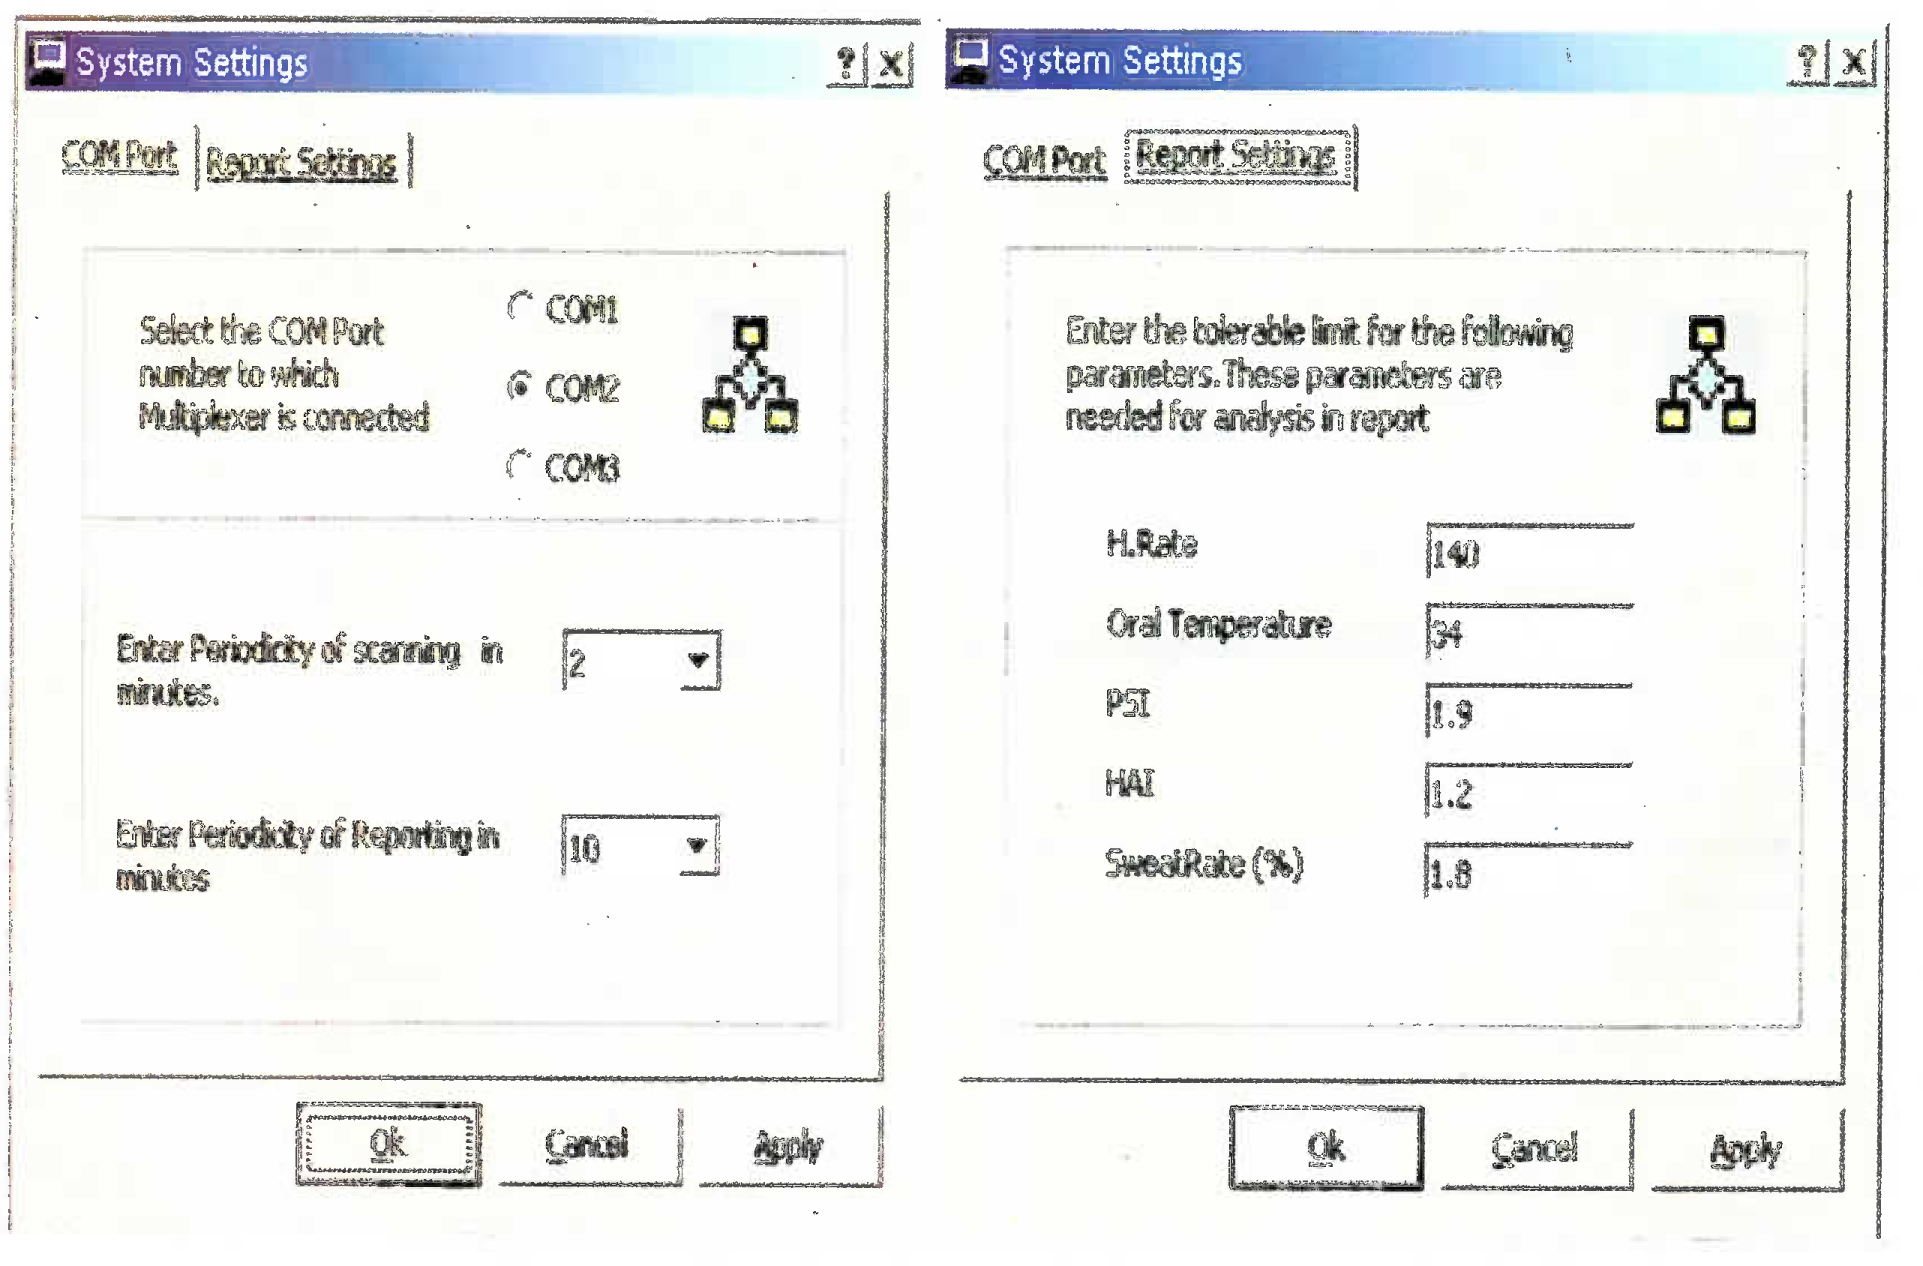
To open system settings dialog box click on Set-Up menu item in Main screen. (Fig 4) System settings screen (Fig 5)contains two tab window i.e. COM Port and Report settings.
COM Port screen Upper frame gives the option to select the COM Port to which multiplexer is connected. In lower frame the periodicity of scanning in minutes, both for reports and during the test, can be set. While running the test, data will be collected continuously from devices But user sheet, data table window and report window are refreshed at different interval.
Report Settings screen In this screen threshold values (viz for tolerable limit) can be entered for reporting parameters. DA software will check these values while generating report to give remarks as ‘Acceptable’ or ‘Unacceptable’.
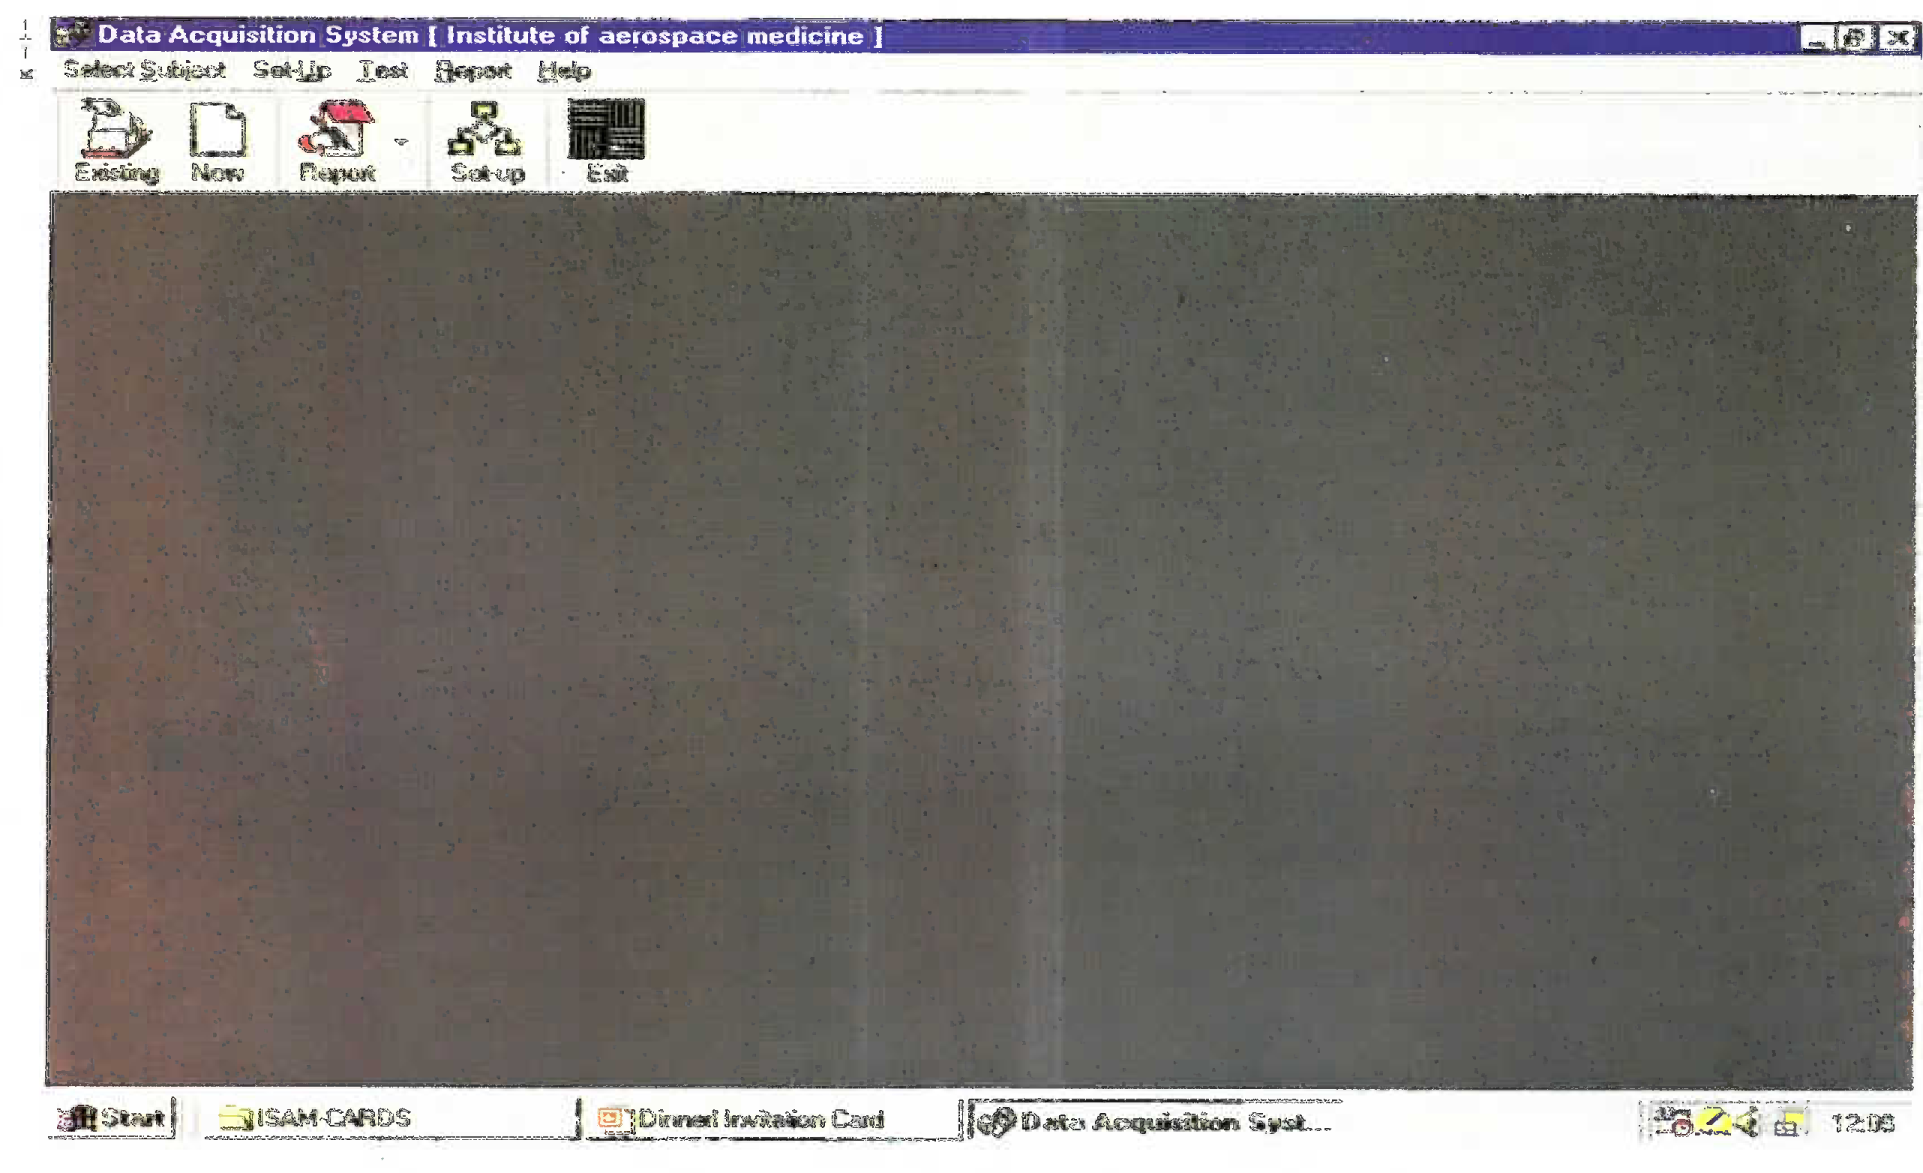
Main Screen
Comport and Report Settings Screen
Use of Template File by software Refrence.xls file acts as template for subsequent operations. When new subject is opened, software will copy all format information from template file (Refrence.Xls) to current subject’s sheet. Software will open the subject’s sheet for editing. User has to enter Subject’s bio-data first time. If a subject has already undergone the test then his data will be available in the “Reports-new” folder inside application directory.
Results and Discussion
Data Acquisition System was developed, by combining Hot Cockpit (Test chamber) HCS, ISU, EKG machine. Weitek weighing scale, Multiplexer, computer and specially written DA software. (Fig 6) DA Software is the software developed for collecting the input data, automatically, from the various instruments which are interfaced to computer through a Multiplexer.
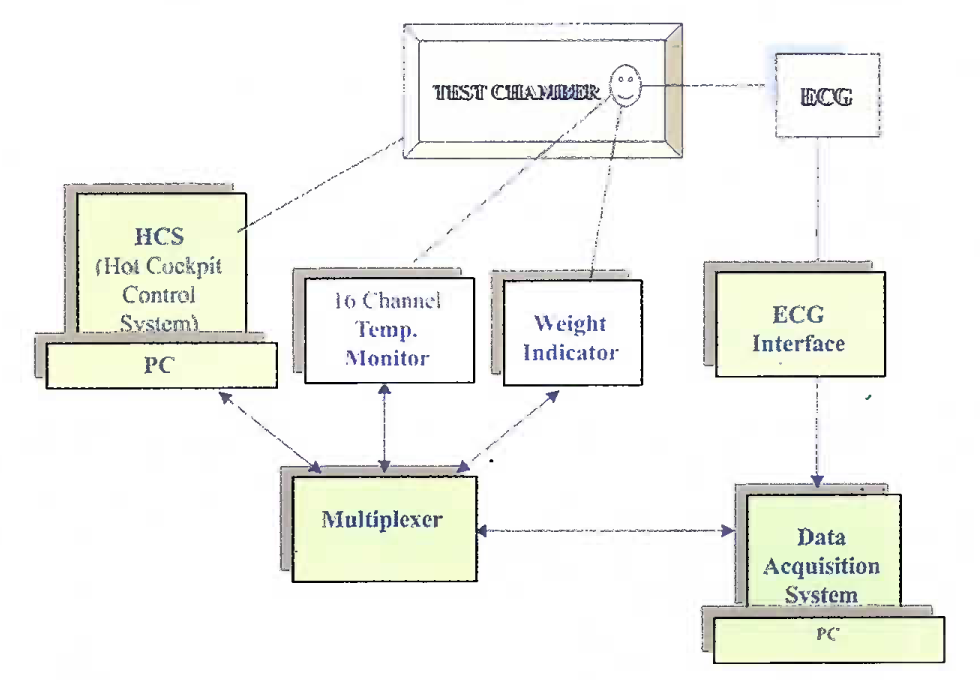
Schematic Diagram of Data Acquisition System
Installation of DATA-ACQUISITION Software for Heat strain Analysis:
System requirements Any PC with Intel class processor, Microsoft Windows 98 Operating System, Microsoft Excel pre installed on PC and Standard Serial Port.
Setting up Data Acquistion Run setup.Exe from the Data Acquisition CD to install the software. Please note that DA Software is required to be installed in a path with short names (Eg: “c:\data”) folder. This is necessary, since some components in this software do not take the long file name for operation. When DA software is installed, it automatically creates the following folders in the application path.
Repos: All data sheets belonging to subjects will be stored in “Repos” directory.
Reports-new: All the reports created by running test will be saved in reports-new directory.
Reports-old: All the reports created by entering old data will be saved in Reports-old directory
Help
Organisation of Data Acquisition Software DA Software is organised in different modules as per the following details.
Data Storage module This involves the storage of subject’s data including his Bio-data and Test data. One Microsoft Excel Sheet is dedicated to one subject. This sheet will always be growing, whenever test it conducted on a subject. The data sheets for a subject can be found in the “Repos” directory, after the completion of test.
Data collection module This Module is responsible for collecting data from various devices and generates error if any device fails to give out data. When test is running this module invokes sub applications to switch Multiplexer; then it runs sub tasks to get the data from devices. If these sub tasks fail to retrieve the data from devices then Manual entry screen will be displayed which prompts user to enter data manually and correct the connection or anything which is missing.
Reporting module Reporting module is responsbile for generating the report and opening report based on existing data. This takes care of maintaining the tables and making observations at defined intervals for reporting parameters.
Data presentation module This module displays the data during running of the test in a systematic way. Meter components and various tables are used for displaying values.
Data editing module This module helps the user to edit existing data, which have been noted down during the course of test. This module opens the subject’s sheet with Excel software for editing.
Starting the test On opening of DA software, a default window with Main screen having menu item and Tool bar item opens.(Fig 4) A test is conducted on a subject by following the undermentioned steps.
Opening a new or existing personal data sheet Fasst step to follow during the conduct of test is by entering the subject’s bio data in the data sheet.
-
Opening new data sheet A new data sheet can be opened by clicking on menu “Select Subject” and then menu item “New”. Alternatively, “New” toolbar button can be used. Below shown message box will appear on screen.
Click “Yes” to continue. A new data sheet (Template sheet) will be copied for subject and will appear as shown below (Fig 7).
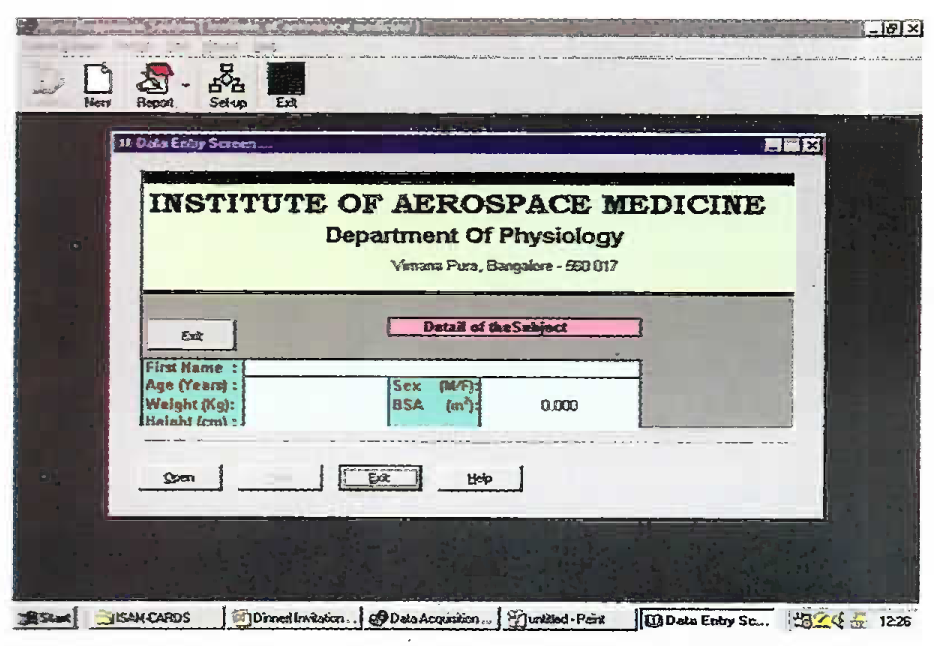 Fig 7:
- New Data Sheet
On clicking open, DA software will open temporary Excel sheet for the subject. Enter all the information about subject (Bio-data) and press exit button provided on the sheet or press Close Button on the top of the Excel sheet. Although some of the fields can be skipped but ID number field is mandatory. The file will be saved with whatever data is there in ID number field. Once all the details are entered, the “Test” button on Data Entry Screen will be enabled, indicating that software is ready to conduct the test.
-
Opening Existing Subject’s Sheet For opening Existing subject’s sheet for testing, click the menu “select Subject” and Menu item “Existing”. Alternatively, use the “Existing1” toolbar button to open the existing subjects’s sheet for testing.
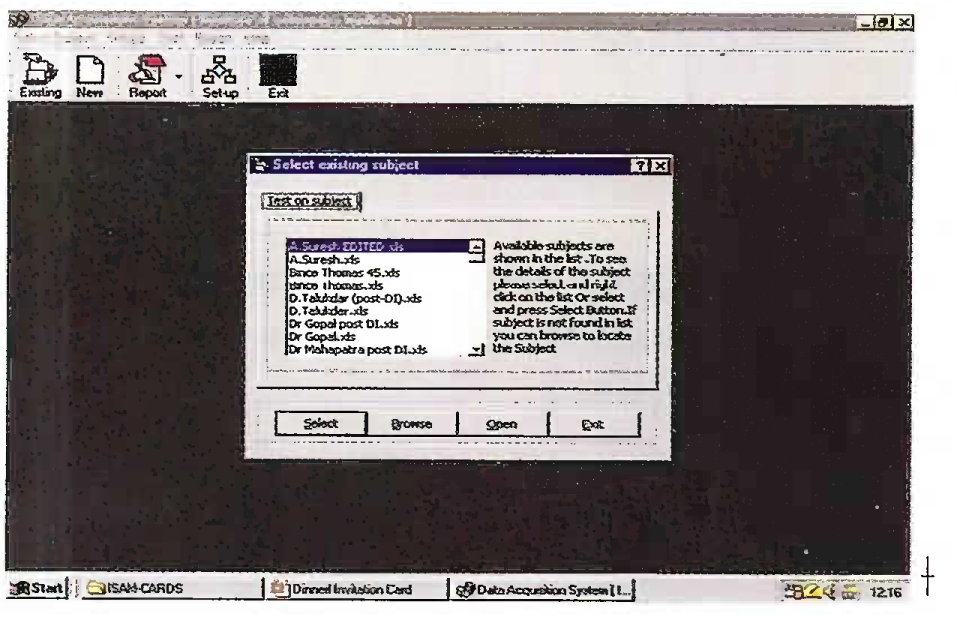 Fig 8:
- Select Existing subject screen
(aa) Select button in this screen selects the selected subject’s sheet from the list for testing.
(ab) Browse button opens the File open dialog box to open subject’s sheet from remote location (which is not present in the “Repos” directory).
(ac) Open button will open the subject’s sheet for editing.
(ad) Exit button will unload the “Select Existing subject” dialog box without doing anything.
On selection of subject’s sheet, the “Select Existing subject” dialog box will automatically disappears. On selection of the existing subject or new subject, “Personal data screen” window will appear as per details shown in Fig 9.
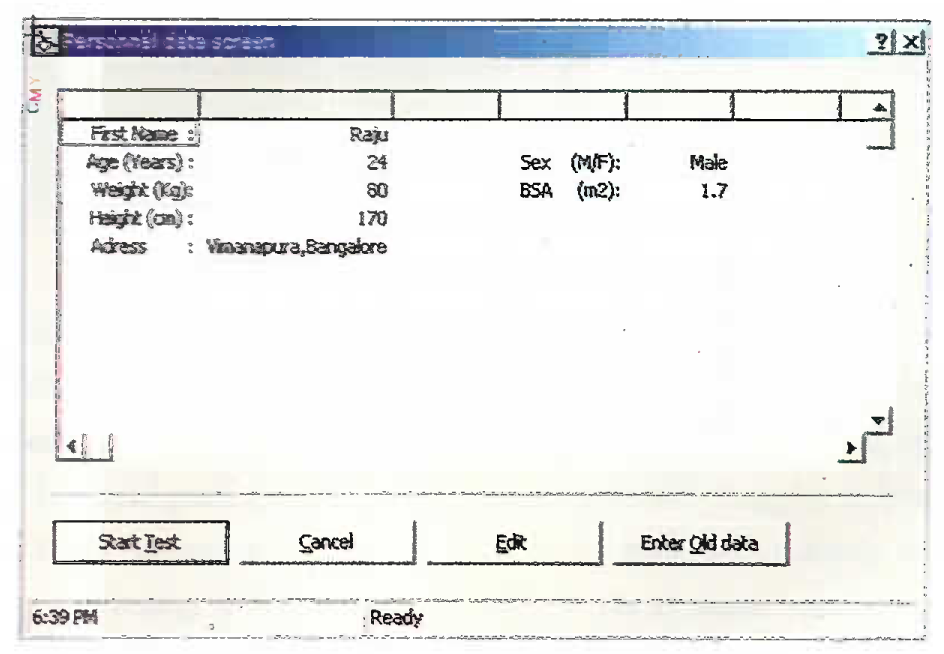 Fig 9:
- Personal data screen
-
Features on Personal data Screen
In this screen following four command buttons are seen.
(aa) Start Test Starts the test on selected subject. The subject may be New or Existing.
(ab) Cancel Cancels the test, unloads the “Personal data screen” and closes the subjects’s sheet. Closing the opened subject’s sheet is important because without closing the previous sheet another sheet can not be opened.
(ac) Edit This command opens the selected subject’s sheet for editing. The details of the subject can be edited and then the sheet can be closed again to run the test.
(ad) Enter Old data This simulates the actual test. To enter old data noted down for a subject, disconnect all instruments from PC by removing RS232 cable connected on COM Port. Then open new sheet for subject as explained above. Then in “Personal data screen”, Press “Enter Old data” button.
-
-
Entering Body Weight: On clicking start test, one dialog box as shown in Fig 10 will appear.
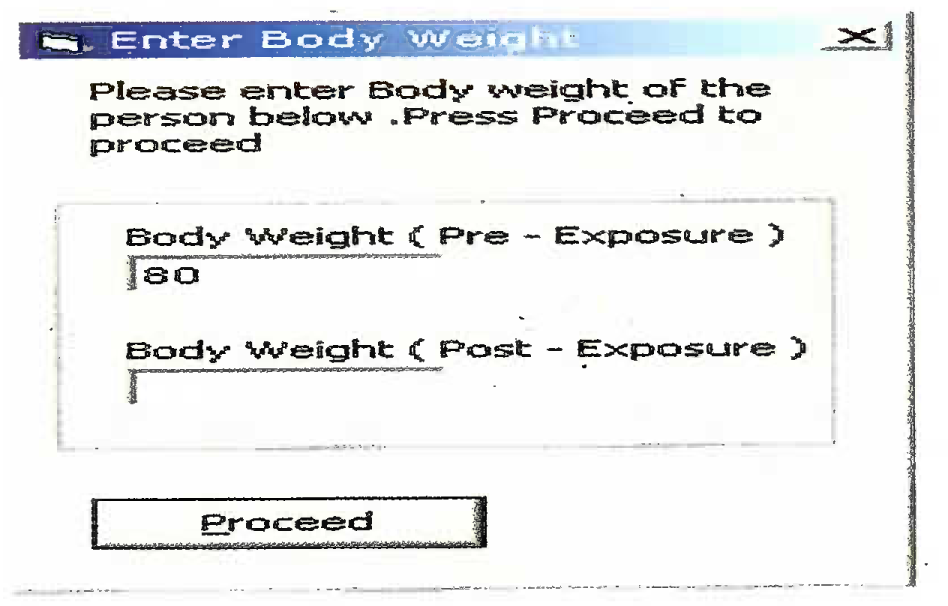 Fig 10:
- Body Weight dialog box
Enter Pre-Exposure nude body weight of the subject and click Proceed. This Pre-Exposure body weight is the one, which was taken before the instrumentation of the subject. When test ends, again this dialog box will be shown. At that time it is required to enter Post-Exposure nude body weight, which will be taken after subject comes out of hot cockpit and all the electrodes and instruments are removed from the subject and the body dried of sweat. DA software utilises the difference in the Pre-exposure and Post-exposure body weight to calculate the amount of sweat secreted during the heat exposue.
-
Staffing of Pre-Exposure test phase After the entry of Pre-Exposure body weight and clicking Proceed, test starts running as Pre-Exposure and all the instruments start feeding data to the DA software once in every 2 Minutes (default). This window consists of 6 tabbed screens(Fig 11), Any one screen can be displaced duing the test by clicking the particular Tab.
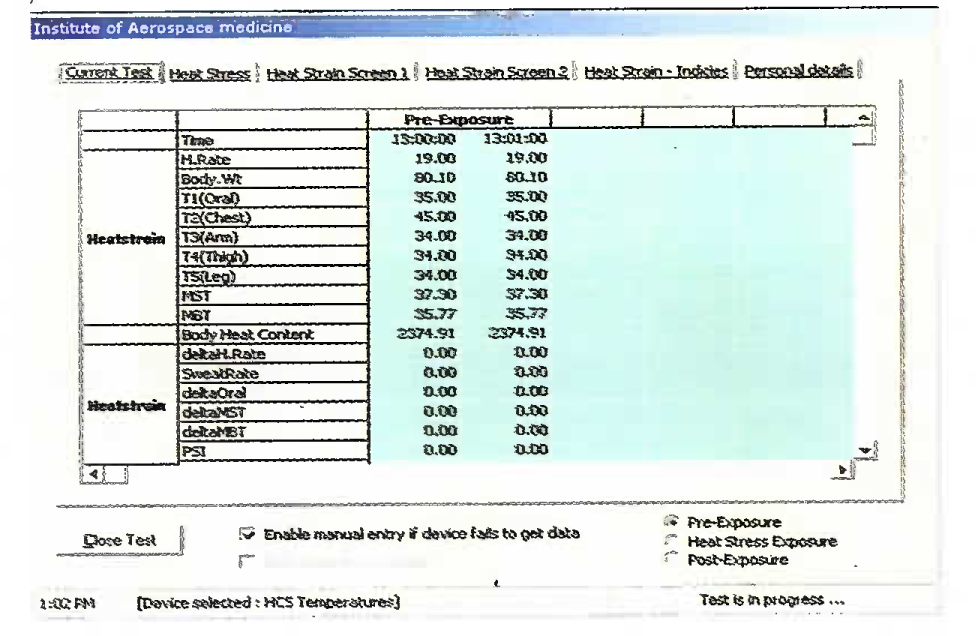 Fig 11:
- Current test Screen
Following information is available in the displayed screen.
Current test This Screen displays all current test parameters in a tabular format. All raw data and calculated fields will be shown. These values will be updated (in a new column) once in every 2 min (default). Periodicity of scanning can be changed through Set-up screen.
Heat Stress Screen This Screen displays mainly Heat Stress paramters in a meter format. These values will be updated (in a new column) once in every 2 minutes (default). Periodicity of this scanning can also be changed through Set-up screen.
Heat Strain Screens 1 and 2 - This Screen displays mainly Heat Strain parameters in a meter format. These values will be updated (in a new column) once in every 2 Minutes (default). Periodicity of this scanning can also be changed through set-up screen.
Heat Strain Indices This Screen displays mainly Heal Strain indices in a meter format. These values will be updated (in a new column) once in every 2 Minutes (default). Periodicity of this scanning can also be changed through Set-up screen.
Personal details This screen displays Personal details with two tables. Above table will contain Bio-Data of the person. Below table will contain reporting parameters. These reporting parameters are updated (in a new column) once in every 10 Minutes (default). Periodicity of scanning data for reports can also be changed through Set-up screen.
-
Starting of Heat Stress Exposure Phase To move from one test phase to next phase (from Preexposure to Heat Stress Exposure or Heat Stress Exposure to Post-Exposure), click the respective options buttons on right bottom side of the screen. When test phase moves from Pre-Exposure to Heat Stress Exposure “Body Weight is available” option will be enabled. This is because the initial body weight during heat stress exposure is taken as a reference Pre-exposure body weight for calculations. Where as all other values from all other fields of Pre-exposure will be taken as reference for calculations. So when system scans first time in heat stress exposure phase and if the body weight value is proper then select the “Body Weight is available” option.
The status bar which is below the screen will display current time and various messages like, from which device now data being recorded etc.
During testing, the sub programs will continuously run and get the values from devices. But it will be refreshed on the meters and tables only during the specified intervals as set in the setup screen.
Deselecting the option “Enable the manual entry if device fails to get data” will prevent Manual data entry screen from popping up (default is selected).
Closure of test phase: To end the test, press Close Test button.
Extra Features during test phase
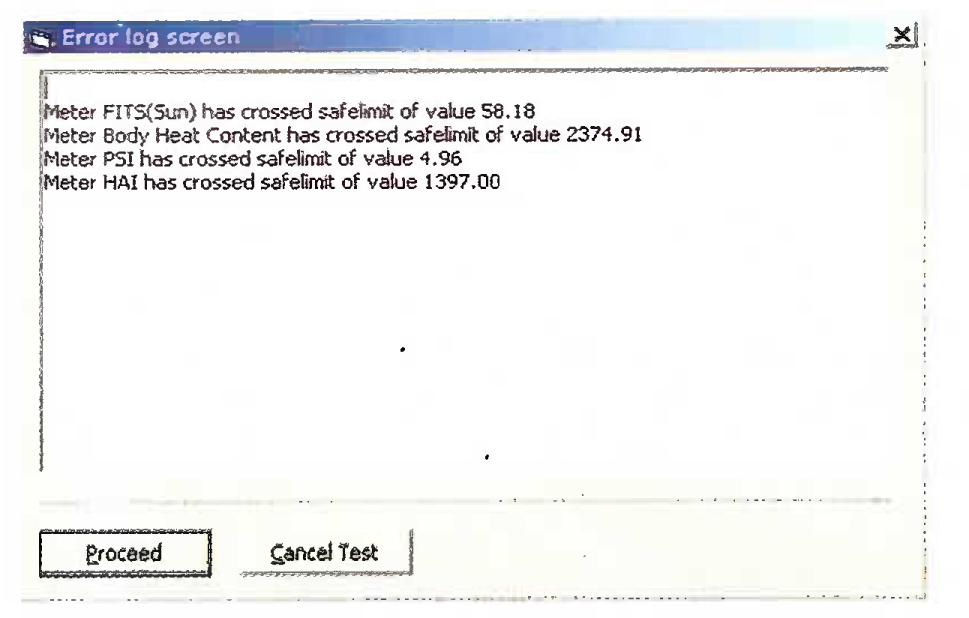
Error Log Screen Fig 12 shows Error Log Screen. Whenever meters, tables are refreshed at specified interval, if some meter’s value goes beyond set limit then it will make one entry in this Error log screen. By seeing this screen it is possible to assess whether Test Run is with in the set normal limit or some thing is wrong. If anything is wrong, a decision can be taken to either abort the test or go to a particular screen (by pressing Tab) and change the meter’s safe limit to some high value. This screen will not influence (block) the test anyway. Test will go on normally in the background, till cancelled Test Tab is clicked in Error Log Screen.
Error Log Screen
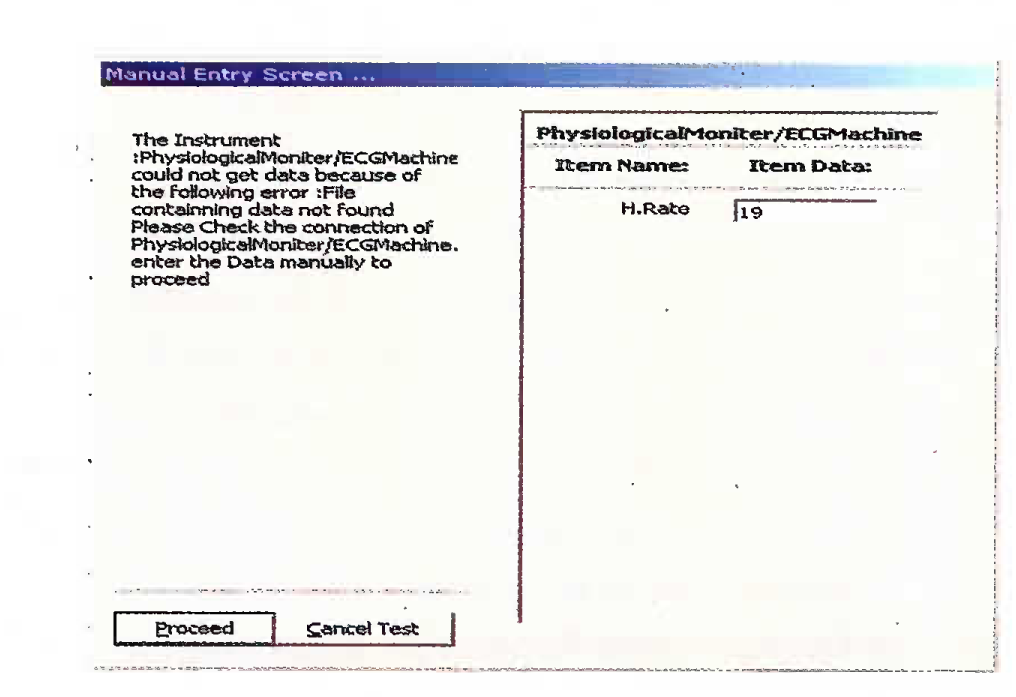
Manual Entry Screen Due to some reason if data could not be retrieved from any device, then component maintaining that device will generate manual entry screen. The reasons may be due to not connecting device properly or absence of application that gets the data from specific device etc. These screens are also shown during the entry of old data for a selected subject as at that time, all the connection from devices to PC are disconnected. This will block the whole operation of system until some value read manually from the device are entered. Press “Proceed” button to continue the test looking for data from other devices. If there is a need to cancel (exit) the test then press “Cancel Test” button.
This screen can be avoided by deselecting the option “Enable the manual entry if device fails to get data”. Current Test Screen (Fig 11).
Manual Entry Screen
Reporting Module Data Acquisition generates the report after every test by default. Report format (Appendix ‘A’) is as explained below.
After heading and address lines, the first line is the record number. This is the copy of number of test conducted for a subject. This information will be stored in the data sheet for a subject. Next few lines are subject’s Bio-data. Number of lines depend on number of rows dedicated for Bio-data in Template file. Next four lines give the Heat stress protocols (Dry bulb Temperature, Wet bulb Temperature, Globe Temperature and WBGT). These values are the average values of respective fields derived from meters. Next block is Heat Strain Response. This block will have fields for Time, Heart Rate, T1 (Oral), MST, MBT, Sweat rate, PSI, HAI (Cal/m2), Cl and ACS. These are the values recorded during pre-Exposure and Heat Stress Exposure. Only one column will be allocated for Pre-Exposure. While running the test all these values can be found in “Personal data” window in Test screen. Remark on the heat strain run appears at the end of report. This is based on threshold values entered in setup screen. If any of the observed values (during test) in any of the column exceeds the threshold value for that field, then remark will be “unacceptable”. If any value for some reason goes beyond limit (even if device is not working or formula is not correct in Template file, remark will be “unacceptable”).
After the closure of test, report can be opened from “Report” - > “Load report” menu item. (Fig 4) Reports will be saved in Reports-new (from test data) or Reportsold folders (after entering the old data) in application directory. Reports can be loaded from any of these directories. When report is generated by default it will be saved with current date-month-year as name in Report-new folder. When any report is loaded or when new report is generated, it can also be saved with different names. For this purpose “save” or “save as” menu items can be used. Report will be saved always with Rich Text Format (RTF). However, the format can be changed to Text Format. But Plain Text format won’t retain formatting information in the file. The font in the report also can be changed by using “Option” -> “Font” menu item in report screen. A loaded report can also be printed. “Report” -> “Print” menu item in report screen is used for this purpose.
Generating Report As mentioned above reports will be generated automatically once the test ends. However, a report can also be generated from existing subject’s data sheet. Use “Report” -> “Generate report” menu item in Main screen for this(Fig 4). Report generation wizard will help to generate the report. This wizard will load the data from selected subjects’s data sheet and the range of data, which should be taken for generating report, can be manipulated. Fig 14 shows Report wizard after data is loaded. In this screen select starting row and ending row of any test and press “Next” command button (there may be number of tests done on one subject). Rows can also be selected with the help of mouse pointer. Fig 15 shows Report wizard after selecting relevant data. In this screen select the rows, which represent Pre-Exposure and then Heat-Exposure. Multiple rows also can be selected. These selected row numbers will be taken as comma delimited fields. While clicking on any row, make sure that a particular radio button is selected. Say, if the row for Heat - Exposure is selected, a particular radio button is selected first and then click on the row giving Heat-Exposure. Click “Next” button to go to next step. Fig 16 shows report wizard after selecting rows representing different phases of test. The values of required fields are extracted from selected rows and shown in table. Heat stress protocol parameters are taken from selected row lying in Heat-Exposure phase. Any date for report can be entered. By this time, enough information are available for generating report. Click “Finish” command button to show the report. It is also possible to go back to any screen by clicking “Back” button anytime and change the values.
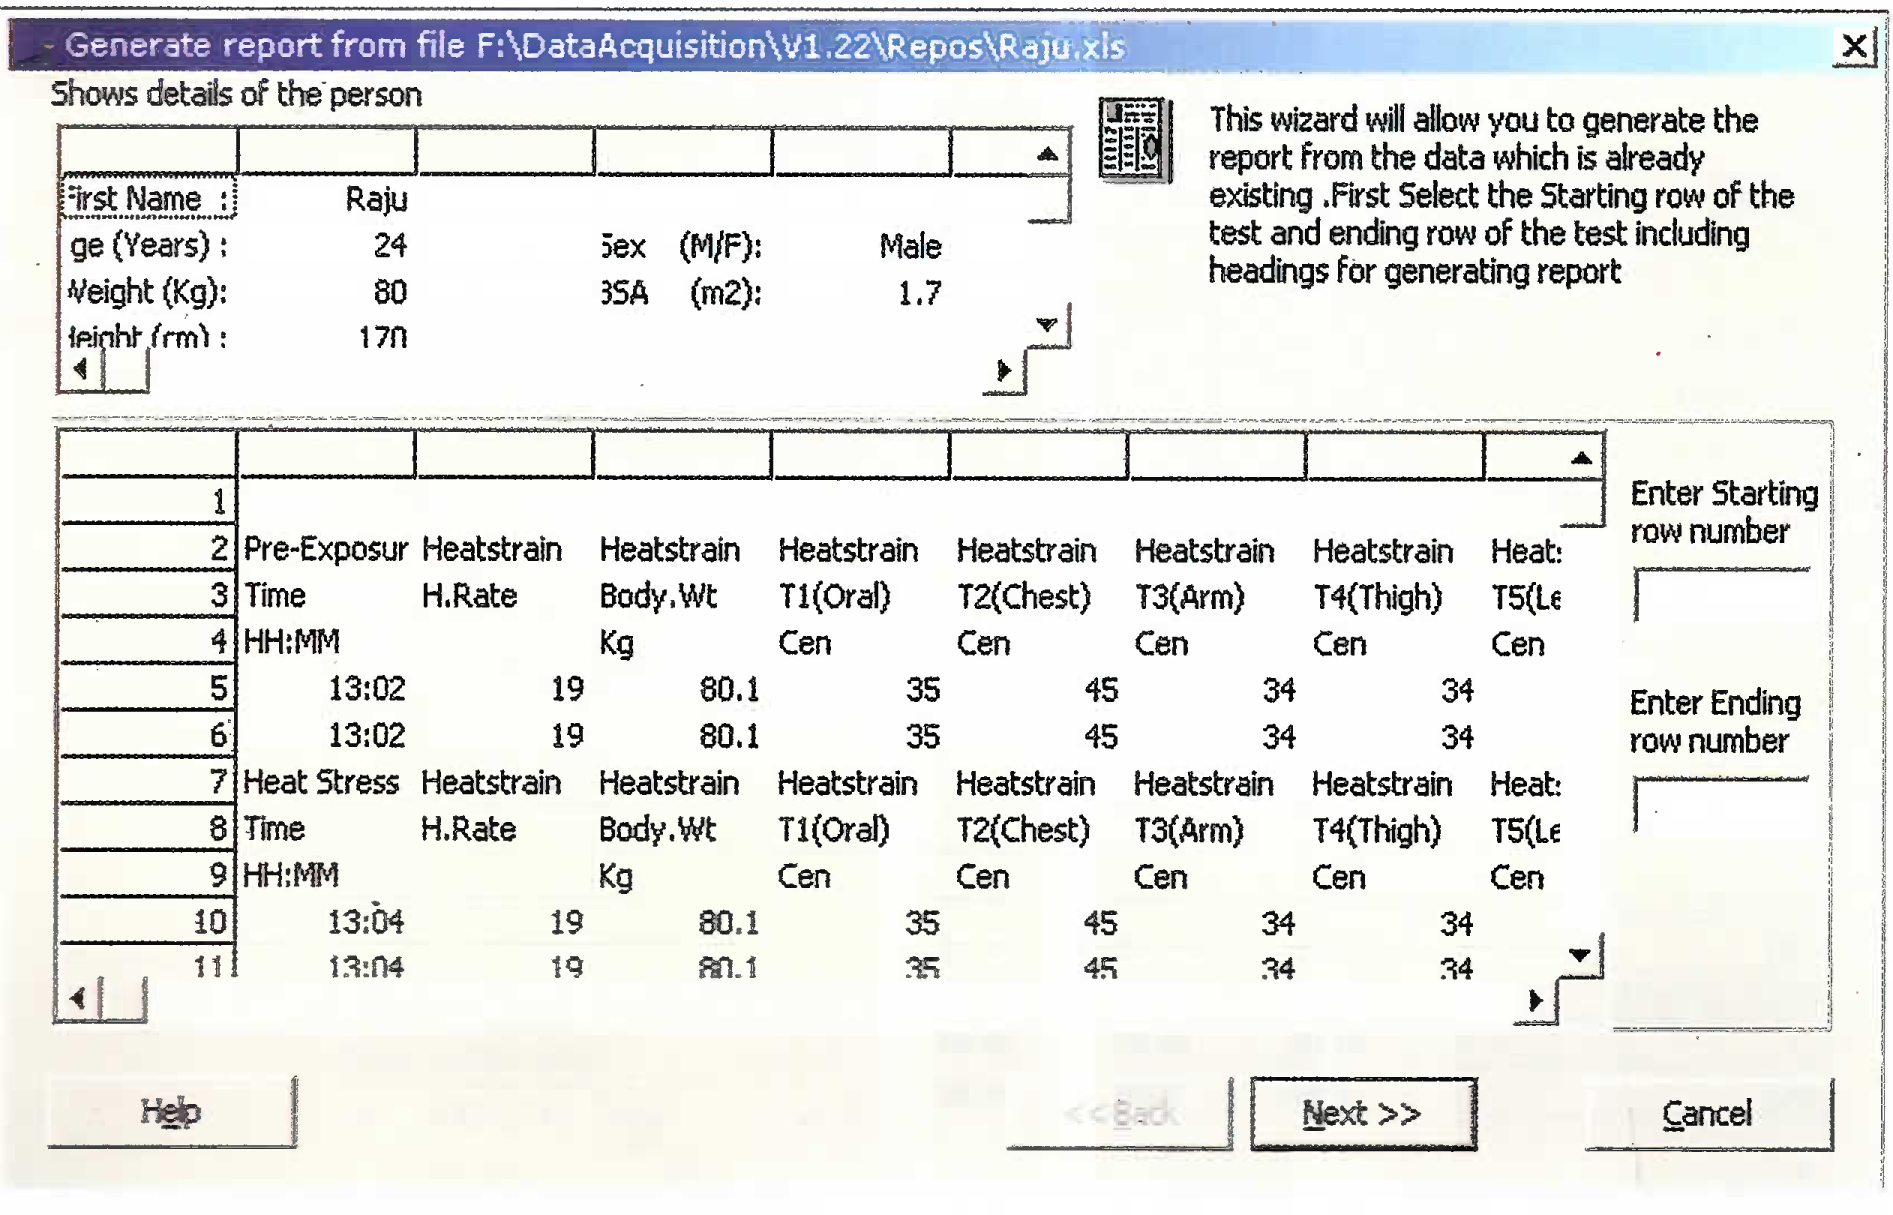
Report wizard after data is loaded.
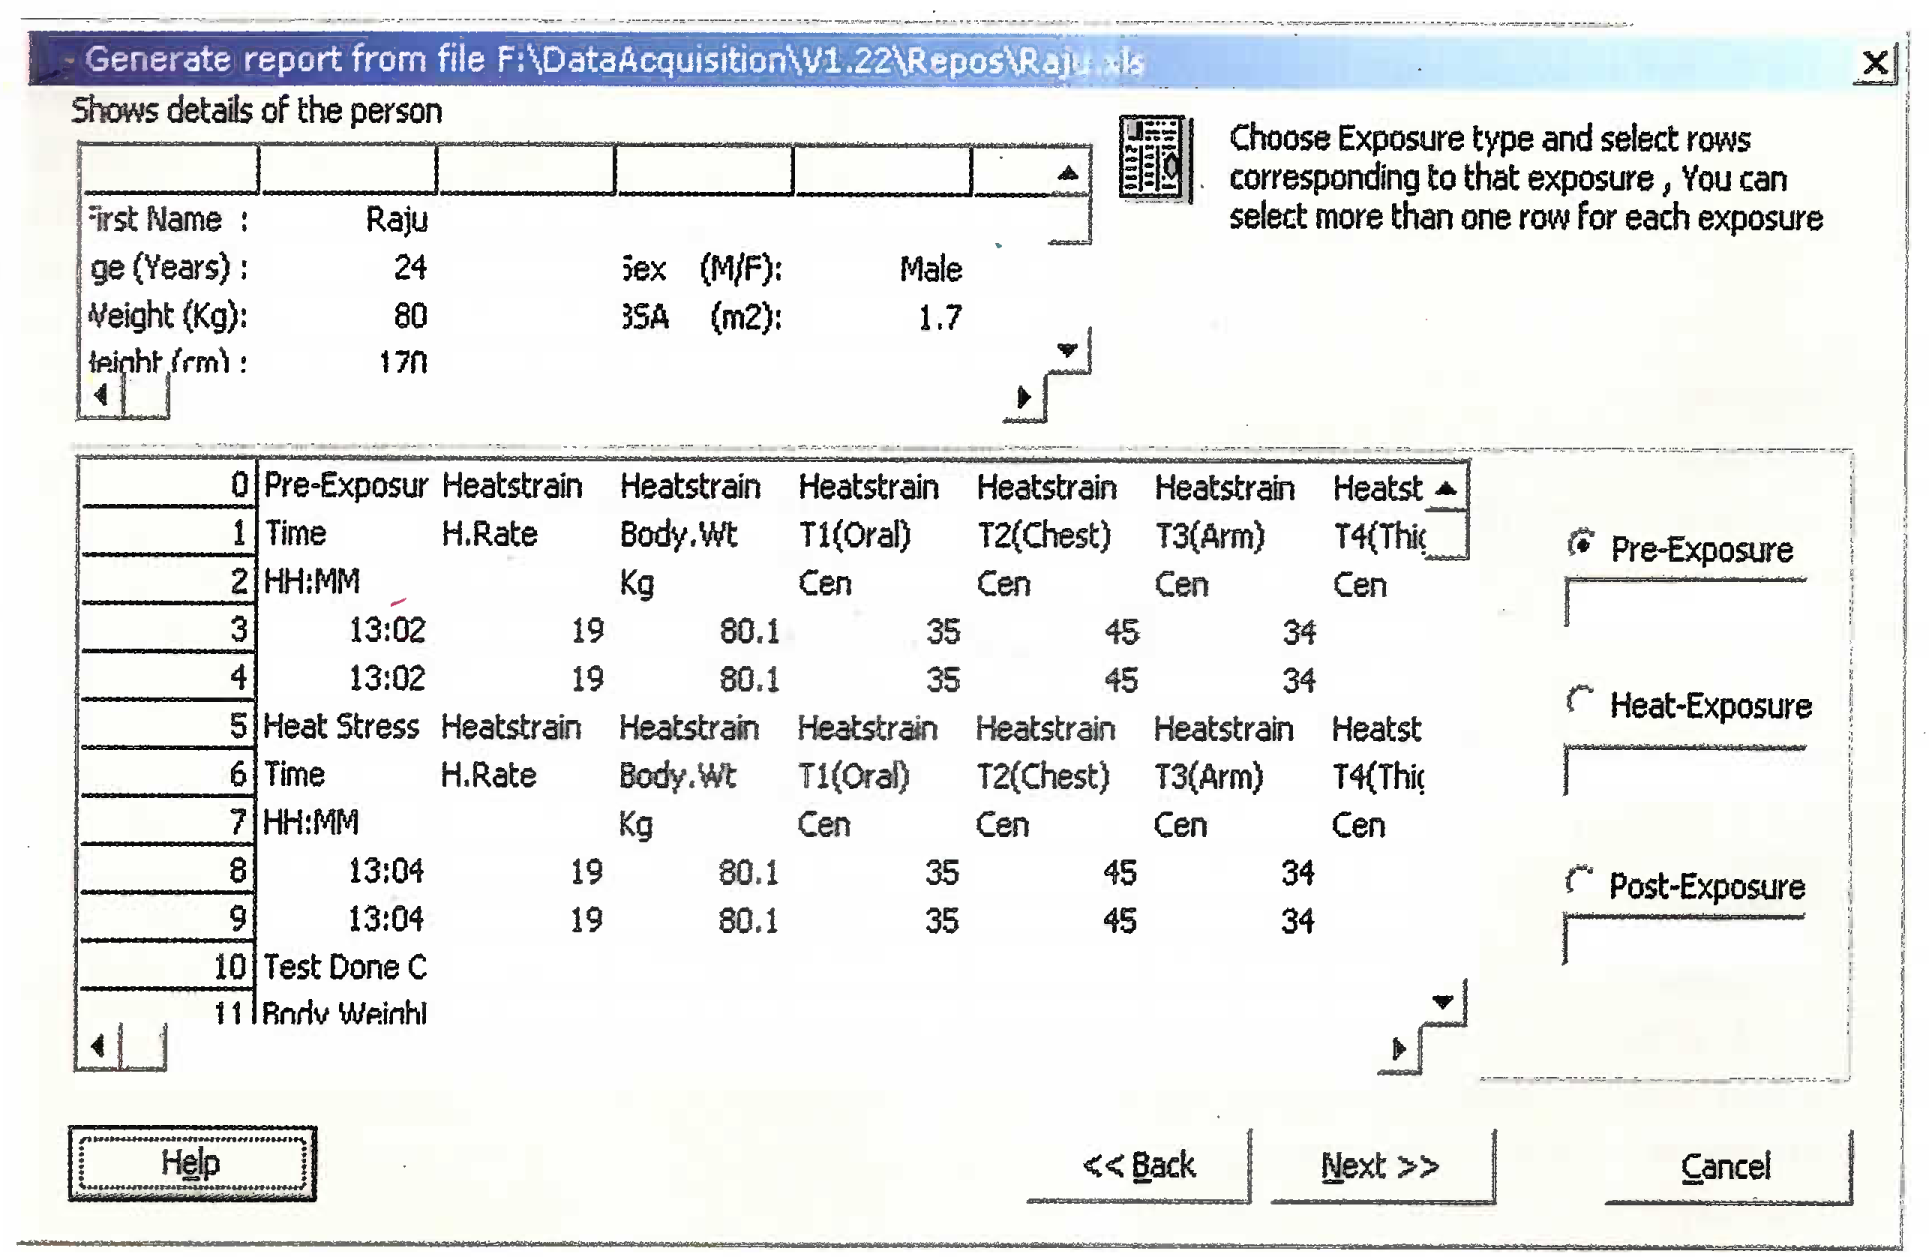
Report wizard after selecting relevant data
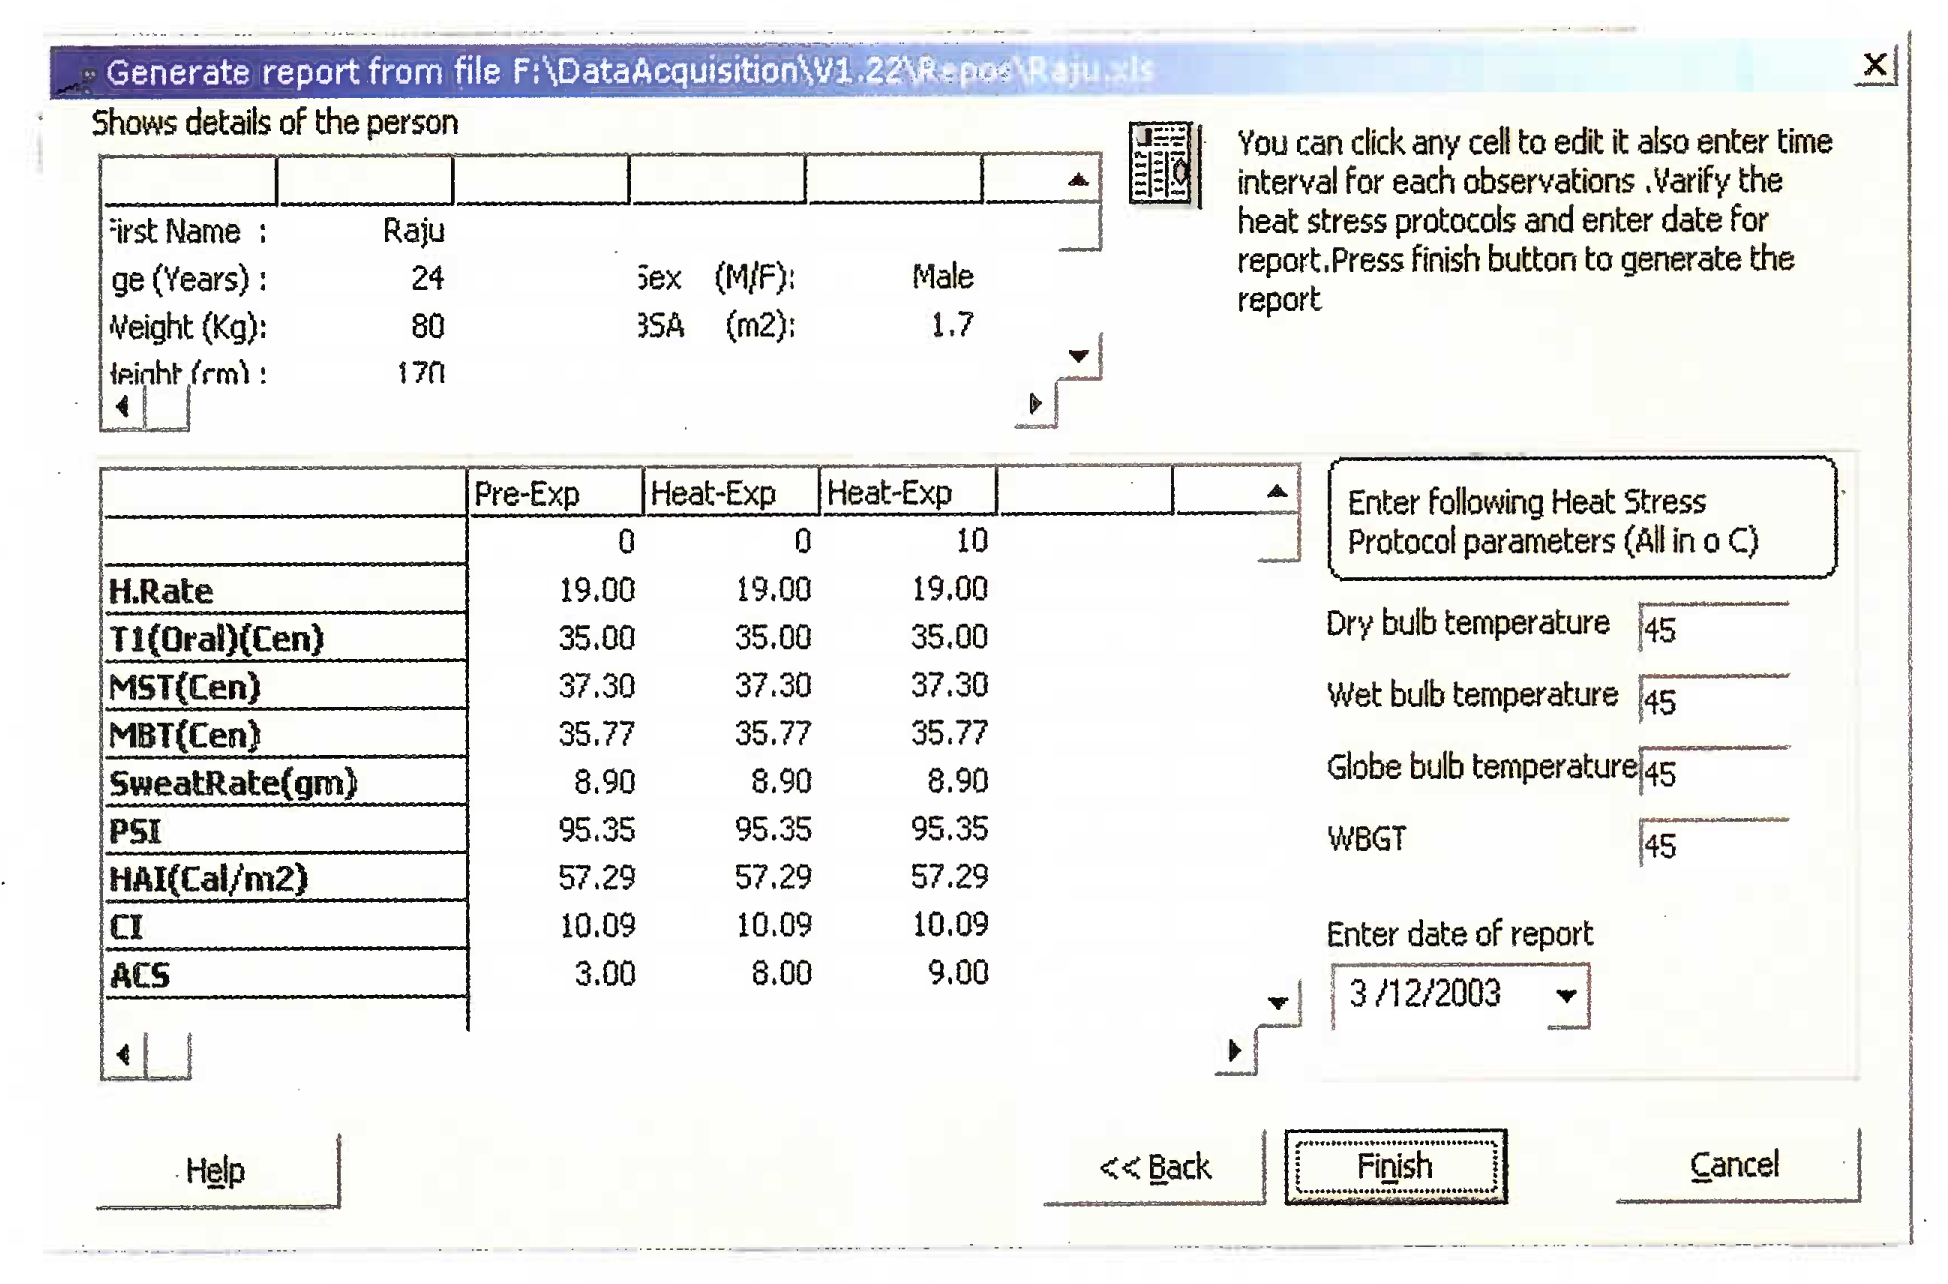
Report wizard after selecting rows representing different phases of test
DA System developed in this project is future ready and it is not going to become obsolete for the long time to come as:
Any new heat stress or heat strain indices suggested in future for heat studies can always be included in the software as Excel sheet has been used as a template file.
One input slot in the multiplexor has been made extra and left empty to get the data from any new equipment added with the present DA System in future.
Extreme flexibility has been provided in the DA System to make manual entry of the data during the conduct of test, in case any of the equipment used presently in the system becomes unserviceable in future. Error screen provided in the system will display the error in getting the data from any equipment during the conduct of the test.
A provision of safety has also been incorporated in the DA system by incorporating the meter screen for all the heat stress and heat strain parameters and indices, which will flash as warning during the test along with the red colour in the meter, in the event of any parameters crossing the safe limit. Flexibility in the setting of these set limits has also been provided. Test can be aborted or continued after seeing the warning depending on the choice/requirement of the person conducting experiment.
Conclusion
Data Acquisition System was developed to study the heat strain responses on exposure to heat stress, by combining Hot Cockpit, ISU, EKG machine, Weitek weighing scale, Multiplexer, computer and specially written DA software. DA software was developed with the help of Microsoft Excel, Visual Basic version 6, MASM and Turbo C language, for collecting the input data automatically from the various instruments, which are interfaced to computer through a Multiplexer. DA software helps in precise assessment of heat stress to which subject has been exposed during the experiment; and assessment of heat strain responses in the subject during experimentation. DA software also helps in online derivation of all the relevant heat strain indices, storage of test data, generating the report based on the current test and even generating the report from the previously conducted test. It will help in the assessment of heat tolerance of the aircrew reporting to IAM for final fitness for flying after a period of temporary unfitness. The system is also of great use to assess the efficacy of physiological measures (acclimation, fluid intake, yoga, physical conditioning etc) to improve heat tolerance in the subjects having lower heat tolerance.
Acknowledgement
Research work was supported by grant from the office of the DGAFMS, New Delhi under AFMRC Project No. 3024/2000 and author is thankful to the organization to allot the requisite fund and necessary authority for this developmental work. Author also whole heartedly acknowledges the untiring efforts and the cooperation of the software professionals, namely Mr Srinivasmurthy S and Mr Sudhindra KS of Nutrax Software (Pvt) Ltd Bangalore, during the development of Data Acquisition System for Heat Strain.
Appendix ‘A’ Institute of Aerospace Medicine (Department Of Physiology) Vimanapura - Bangalore HEAT STRAIN REPORT
| Record Number: 1 | ||||||
| Subject detail : | ||||||
| First Name | : | A. Suresh | ||||
| Age | : | 21 | Sex | (M/F) | : | Male |
| Weight (Kg) | : | 52.73 | BSA | (m2) | : | 1.62 |
| Height (cm) | : | 172 | ||||
| Adress | : | MEG, Bangalore | ||||
| Heat Stress Protocol: | ||
| Dry bulb Temperature | : | 53.44°C |
| Wet bulb Temperature | : | 35.3°C |
| Globe Temperature | : | 52.37°C |
| WBGT | : | 40.53°C |
| Heat Strain Response: | |||||||
| Pre-Exp | Heat-Exp | Heat-Exp | Heat-Exp | Heat-Exp | Heat-Exp | Heat-Exp | |
| 0 | 10 | 20 | 30 | 40 | 50 | 60 | |
| H. Rate | 84.00 | 112.00 | 120.00 | 118..00 | 132.00 | 140.00 | 144.00 |
| T1 (Oral) | 36.10 | 37.60 | 37.90 | 38.20 | 38.30 | 38.40 | 38.80 |
| MST | 34.49 | 38.95 | 38.69 | 38.68 | 39.06 | 38.87 | 39.06 |
| MBT | 35.56 | 38.05 | 38.16 | 38.36 | 38.55 | 38.56 | 38.89 |
| SweatRate | 0.00 | 0.08 | 0.12 | 0.22 | 0.29 | 0.40 | 0.54 |
| PSI | 0.00 | 3.66 | 4.52 | 4.86 | 5.74 | 6.30 | 7.10 |
| HAI | 0.00 | 52.77 | 55.83 | 61.15 | 66.37 | 66.46 | 75.37 |
| CI | 0.00 | 2.70 | 3.12 | 3.50 | 3.81 | 4.10 | 4.68 |
Remarks:
Heat Stress of WBGT (40.53°C) is Unacceptable for sitting, resting subject wearing 1 Clo insulation clothing.
05-Sep-02
Signature
References
- The thermal enironment and human heat exchange In: Ernsting J, King P, eds. Aviation Medicine (3rd ed). London: Butterworths; 1999. p. :192-202. In:
- [Google Scholar]
- Heat stress. Occupational Safety and Health Administration US Dept of Labor. Section III, Chapter 4 Available at http://www.oshaslc.gov/dts/osta/otm/otmiii/otmiii4.html#l
- [Google Scholar]
- Effect of simulated microgravity on body responses to heat stress/ dissertation). Bangalore: RGUHS; 2001-2004.
- Physiological criteria of upper limits of body heating. J Aero Med Soc Ind. 1982;27(1):39-42.
- [Google Scholar]
- A unified system for evaluation and selection of heat stress candidates. J Appi Physiol. 1961;16(1):144-152.
- [Google Scholar]
- A new weighing system for mean surface temperature of the human body. J Appi Physiol. 1964;19:531-533.
- [Google Scholar]
- A physiological strain index to evaluate heat stress. Am J Physiol. 1998;275:R129-R134.
- [Google Scholar]


