Translate this page into:
Contrast sensitivity in IAF aircrew
Abstract
Previous research has reported the usefulness of contrast sensitivity (CS) as a measure of visual capability in aircrew. The purpose of this study was to gather comparative data on an Indian aircrew and non aircrew population. Aircrew comprised fighter and non-fighter sub groups. Psychophysical measurements of binocular contrast thresholds were made in 75 aircrew and 30 non aircrew (20-40 years) with the automated contrast sensitivity measuring apparatus, Nicolet Optronics CS-2000 at spatial frequencies within the range of 0.5 to 22.8 cpd. All subjects had visual acuity of 6/6 or better in both eyes. Individual contrast sensitivity function (CSF), variability and correlations between frequencies followed the standard trends in both groups. The mean CS values of aircrew were higher than that of non aircrew in all frequencies. There was a significant difference between the mean values of fighter aircrew population and non aircrew population in the spatial frequencies 3, 6 11.4 cpd. The mean CS values of fighter aircrew were non significantly higher than that of non fighter aircrew in most frequencies. Further studies are required to substantiate present findings for different applications of CS in aerospace operational environments.
Keywords
Contrast sensitivity
Visual acuity
Vision in aviation

Ideally, occupational selection criteria should be relevant to the tasks required of personnel. Good vision is an essential requirement for mission success in many aviation tasks. Although the importance of other complex tasks that the pilot is required to perform cannot be undermined, vision is the only sensory system which is used to its fullest capacity during flying.
In spite of the advanced electro-optical sensors, visual target acquisition remains the key to successful air-to-air combat. Detecting the enemy first increases the chance of combat success and survival. Visual target acquisition seems a more important critical combat skill than selecting and executing the best manoeuvre in an aerial combat. The targets detected by pilots vary widely in shape and size and must be detected under low contrast conditions, such as haze and fog, as well as high contrast conditions. For example, visual requirements for a combat pilot to detect a target under clear atmospheric conditions over the desert are quite different from low contrast conditions such as those found in haze, fog, smoke, twilight, or dawn conditions.
For initial visual target acquisition, it is important to have good optical quality. Visual processing of this information deals with actual detection of targets. The sensitivity of the physiological retina - brain system uses this optical image for subsequent target acquisition. Further, superior vision can reduce workload. Increased detection ranges of targets means increasing time for the pilot to perform combat related tasks, which in turn reduces workload.
The present and future Air Force missions will require the pilot to have optimum visual capability and visual standards must be related to that capability in terms of task performance under all possible viewing conditions.
Visual Acuity and CS
The most common method for assessing visual capability has been by means of a visual acuity test. The visual acuity is the measure of optical quality. Landolt's rings, orientation of letter 'E' or the Snellen's chart measures the visual acuity. Typical visual acuity targets such as Snellen's chart or Landolt's rings are high contrast, high spatial frequency stimuli. Standard vision charts do not change contrast, they cannot measure visual sensitivity to any except the smallest size symbols [1].
The optical quality by far is the main criteria for all present visual standards in all major air forces in the world. The acceptable visual acuity for F (P) branch during initial entry in the IAF is 6/6 in one eye and 6/9 in the other, correctable to 6/6. The aircrews other than F (P) need to have 6/24 in one eye and 6/36 in the other, correctable to 6/6 and 6/9 [2]. Presently, CS testing is not used as a screener for testing vision for the aircrew in the IAF.
Snellen's test and other visual acuity tests assess the ability to recognize high contrast letters and patterns. However, many complex visual tasks involve the detection and recognition of different sizes of objects that are just visible, as well as high contrast, high frequency patterns. Snellen's acuity does not measure visual sensitivity below 18 cpd. Normal Snellen's acuity means that targets whose size is larger than 3.3 minutes can be seen at higher frequencies only. Conditions reducing target contrast e.g. low target to background contrast; make the pilot use low spatial frequencies, the visual sensitivities of which are not measured using current Snellen's acuity tests [1]. Measuring acuity with such targets says little about how well the person can see low contrast low spatial frequency targets, such as a car on the road at night or a person in the dark movie theatre. Thus the Snellen's chart and other optotypes are not adequate to evaluate an individual's target detection and recognition capability over ranges of target size and contrast used in real situations.
The advantage of the CS thresholds over visual acuity is that they describe how the eye performs at all contrast levels and not at just very high contrast. The threshold curve also delineates the boundary of the low contrast world one never perceives [3]. Gross recognition without identification, such as detecting an island in the fog, is a function of low spatial frequency. Such viewing, as well as the perception of poorly lit objects, depends largely on information delivered by the parafoveal retina sensitive to low spatial frequencies generated by global out lines. Visual acuity measurements do not reflect such performance, since this function is largely foveal, and as such is inoperative at low illumination levels [4].
Another advantage of CS is that there are individual differences in CS which cannot be measured by acuity tests and these differences have important implications for visual target acquisition, target visibility, detection ranges and workload.
Thus there has been considerable interest in alternative tests that might provide a more comprehensive and operationally relevant metric of visual function than the traditional letter chart acuity and might therefore constitute a better biomedical standard for aviation personnel. A widely considered alternative test for evaluating visual capability is CS.
CS and its Measurement
The CS function is an ideal method for measuring the interrelationship between the physical factors of contrast and the psychological factors of individual differences in visual acuity. The ability of human being to perceive the details of objects and scenes is determined to a large extent by how well their visual system can discern contrasts : differences in brightness of adjacent areas. The size of the visual image on the retina also plays an important role in the perception of detail. It is a known fact that as an object recedes and becomes smaller, details with low contrast become difficult to perceive. The reason for this loss in contrast perception is not that the relative brightness of adjacent areas changes rather that the visual system is less sensitive to contrast when the spacing of the contrasting areas decreases. If the spacing of the contrasting areas is regular, it is called a spatial frequency.
The visual system is much more sensitive to contrast at certain spatial frequencies. In dealing with the visual system, it is convenient to define spatial frequency as the number of cycles of the grating that subtend one degree at the eye of the observer. Spatial frequency is usually measured in terms of cycles per degree (cpd) of the visual angle, where one cycle would be a black bar and a white bar. The visual system is most sensitive to sine wave gratings of about 5 cpd depending on experimental conditions. Sensitivity decreases for spatial frequencies above* and below peak sensitivity. Only a limited range of spatial information can be passed by the visual system.
The physiological limit is about 60 cpd, which. again depends on the viewing conditions [3]. '-' ' Contrast is the tendency to perceive an object's properties by comparing them with the properties of the object's background or context. The contrast of, a grating is defined as the modulation of its brightness around its mean level of luminance. The luminance difference between the light and dark band determines the contrast.
For stimuli such as grating that deviate symmetrically on both sides of mean luminance, the term modulation contrast is used. It is also called the Michelson contrast and is generally computed as follows :
where Lmax and Lmin are the maximum and the minimum luminance in the pattern. Modulation contrast will take on the value between 0 and 1. It can be reduced by using gray instead of white in the grating.
If the contrast of a grating is increased from below visibility to where the grating is just seen, then the grating is said to have reached threshold contrast. Gratings of different spatial frequencies require different amount of contrast to reach threshold for the observer. The reciprocal of the threshold contrast is called CS :
CS = ----------- 1
Contrast threshold
Thus, the lower the contrast threshold, higher is the CS.
CS function relates sensitivity to spatial frequency on a Log scale in which the abscissa and ordinate represent spatial frequency; and CS respectively. If the log spatial frequency grating is shown with log contrast, the limit of visible grating results in the inverted 'U' shaped function which describes the; visual “window” which limits the range of size of objects that can be seen under conditions of threshold contrast.
There are two main attributes of a CS test. Firstly, there is a need for constant state of retinal adaptation. This reduces non-linearity in measuring CS due to the eye being in different stage of adaptation. Secondly, all complex objects can be built from a combination of spatial frequencies having different amplitude and orientations or can be broken down to simple sinusoidal gratings which are linear based functions being one-dimensional [1]. Many variables affect CS. Stimulus variables are luminance level, contrast, exposure time, and target motion. Individual variables are training, retesting, individual differences and adaptation.
Applications of CS
Most of the applied work on CS has concentrated on assessing its value for clinical diagnosis and for predicting performance on complex visual tasks. Over the past two decades, CS has become a well established tool for probing the functional integrity of human visual system and has become increasingly popular for both diagnostic and screening purposes [5, 6].
(a) Clinical Applications
CS testing has grown in popularity as a clinical tool for describing visual disturbances associated with various ophthalmic disorders, because the results of the clinical studies are reasonably consistent. The shape and the height of the CS function being vulnerable to pathological changes in the visual pathways, abnormal CS functions show reduced sensitivity at one or more spatial frequencies. CS testing describes visual disturbances associated with various ophthalmic disorders such as those in amblyopia, cataracts, glaucoma, cerebral lesions, multiple sclerosis, retinitis pigmentosa and central serous retinopathy [7]. Often visual acuity tests do not accurately predict the degree of visual impairment brought about by these conditions. With the development of good normative data, CS could become a valuable diagnostic tool. In addition, the CS function has been used as a more complete assessment procedure to evaluate non-pathological changes in the visual system as in early infancy as well as aging through adulthood [8].
A major assumption underlying the use of CS testing is that it predicts whether a patient has difficulty seeing objects encountered in everyday life. The best predictors of thresholds for real-world targets were age and middle to low spatial frequencies [9].
(b) Aero medical Applications
(i) CS as a screener for aircrew
Gray and McFadden had investigated the CS of 297 Canadian Forces aircrew candidates using the method of increasing contrast [10]. They found that the median CS was higher with variability in the lowest and the highest frequencies studied as compared to previous population study done by Ginsburg [11].
McFadden investigated the usefulness of two CS test for aircrew selection. The purpose of the study was to obtain a more precise estimate of the variability of CS in the aircrew population, using the Nicolet CS 2000 System and the VISTECH VCTS 6500 Test System [12].
The CS of 50 aircrew candidates and 23 subjects was measured. Two independent measures were taken on the 23 subjects to get an estimate of test-retest variability. Mean CS with the 2IFC methodology was significantly higher at 1.5, 3 and 6 cpd than with the VCTS 6500. The variance in the scores of the aircrew population on the VCTS 6500 was almost identical to the within-subject variance based on test-retest data. Thus, any differences in CS across the aircrew population could not be picked up by1 the VCTS 6500. The variance in the scores of the aircrew candidates with the 2IFC method was larger than the within-subject variance, but the evidence suggested that most of this variation was due to factors other than differences in CS across the aircrew population. It was concluded that neither test was suitable for screening the CS of Canadian Forces aircrew candidates, but that both tests could be useful for testing more heterogeneous populations. Moreover, since the shape of the CS function varies across tests, absolute scores on afferent tests are not comparable.
Nevertheless, many air forces including the USAF are outlining standards to include CS in their screening, since it is a measure of basic visual capability. If that visual capability is degraded sufficiently, visual performance will suffer. These tests could be useful in assessing the potential degradation of visual capability from visual enhancement and visual protection devices used by aircrew. These tests should also be suitable for assessing CS or for the evaluating the usefulness of CS for predicting performance on more complex tasks in a more heterogeneous population.
Further comparison of different test methodologies and mediums are required. The current results provide some evidence that different tests of CS do not measure identical aspects of visual capability. Thus one test may be useful for predicting certain types of performance and another may not. Comparison of different types of tests is required using a heterogeneous population. In such studies, multiple measures should be taken to ensure that the scores are representative of the individual's CS and not their test taking ability at a particular time.
(ii) Target Identification, Acquisition and Detection
Results of studies on performance on complex visual tasks and CS are equivocal. Some studies have found a relationship between CS and a pilot's ability to detect approaching aircraft [13], a driver's ability to detect road signs [14] and a subject's ability to classify tanks and human forms against complex backgrounds [15]. Other studies investigating similar parameters have found no relationship between performance on these type of tasks and CS [16, 17, 18].
For vision limited tasks such as target acquisition in a high performance aircraft, the pilot should have maximum optical and physiological visual capability. Presently, there is limited data to determine definitive population studies in CS and how they clearly relate to the target acquisition. However there are some studies which have explored this relationship.
In an early study cited, population estimates of CS showed that an average difference of 2.36 in sensitivity exists in 90% of the population. This suggests that observers with increased CS will be capable of acquiring targets further away than less sensitive observers in certain conditions. The study also showed that, increasing the contrast by a factor of only 1.5 to 2 is needed for going from a chance detection to definite detection. Therefore, while a highly sensitive pilot is able to see the target definitely, the less sensitive one is still unsure of its presence. These differences are most important as in .today's combat scenario, where split second decisions mean the difference between success and failure of a mission [1].
Ginsburg studied the CS functions of three pilots who had Snellen's acuity 20/20, 20/15 and 20/ 25. Although each pilot had good acuity, there were significant differences in their CS functions over range of spatial frequencies. It showed that subject with 20/ 20 acuity had higher sensitivity than other above 6 cpd but had lower sensitivity to lower frequencies. Ginsburg suggested that CS relates to target acquisition over the full range of target size. An observer with highest CS can be placed in the most vision intensive tasks to optimize the probability of success. [1].
Ginsburg et al (1982) found that Air Force pilot's CSF predicted the distance at which air to ground targets were detected in an aircraft simulator. In this study, eleven instructor pilots had their acuity measured by both conventional and CS methods. Scotopic CS showed the highest correlation with slant detection range (0.83). Conventionally determined visual acuity proved to be a poor predictor of a pilot's ability to detect a small low contrast target [13].
Training can alter an observer's use of visual information. If a pilot who detects the target (MiG aircraft) when it appeared as a distinct form could be trained to detect the target when it appears and indistinct, then detection ranges can be increased by as much as 50% reducing workload arid increasing operational performance. Thus, CSF is a good predictor of the observer visual performance.
Therefore, research has revealed that individual differences in CS among normal individuals have definite implications for visual performance in operational environments as these differences in visual sensitivity are related to the detection and recognition ranges.
(iii) CS as a sensitive metric of degraded performance
There is mounting evidence that the visual system has specialized mechanisms in the brain, which is selective to narrow ranges of spatial frequency information [19]. By scanning a high contrast grating of a particular spatial frequency, one can fatigue or adapt the specific analyzer tuned to the frequency of the grating being scanned. The CS will then be decreased only for grating of that or nearby spatial frequency.
The CS was first used as an index of reduced visual efficacy when viewing through aircraft transparencies by Ginsburg [20]. He found that reductions in the CSF due to Head up display were correlated to reduced target detection ranges. Ginsburg argued that a measure of contrast reduction as a function of target spatial frequency reflects the integrity of the total optical system (transparency, media, and human observer) and is therefore a more complete performance measure than any single estimate of optical distortion, scatter, glare, contrast loss, or reduced light transmission for a given transparency.
In a study measuring aircraft windscreens, Hughes and Vingrys found that CS was significantly reduced for frequencies above about 6 cycles / degree viewed through the windscreen and that the addition of a glare source further reduced CS for all spatial frequencies greater than 1 cpd. [21]. CS tests have also been used to assess the effect of systems for visual protection (visors, laser goggles) and visual enhancement, like night vision goggles (NVG) and thermal imagers [11, 20]. Rabin made comparisons of measurements through NVG's to measurements obtained without the device (at the same level of luminance and color) and found NVGs distinguish between effects of luminance and noise on CS [23J.
(c) Normative Data Studies
One persistent obstacle in routine use of CSF in vision testing is the absence of adequate normative data. Ginsburg et al measured the static and dynamic CS functions (CSF's) from a population of 265 nonclinical observers [11]. He found the method suitable for routine use in vision screening. They retested these subjects after six months and found that the differences were small and non-systematic suggesting the stability of CSF measures over a period of six months.
Yates et al studied the CS functions of 103 normal, healthy young adults and compiled normative statistics for the group [6]. They found that the maximum CS for the grouped data was 125 at 4 cpd. They observed that the difference in CS above 20 cpd was diminished for subjects who had shown large differences in CS at 4 cpd, which implies that they are approaching equal sensitivities at higher spatial frequencies. The mean 'cut off frequency estimated was 8 cpd by the method of linear regression.
Long and Penn measured CSF of sixty college age subjects who were prescreened for minimum 6/6 acuity and examined twice on an automated CS system (Nicolet CS 2000 CS testing system) [24]. They found marked differences between the CS scores in the present work and the normative CSF reported by other investigators using similar methods.
Temme, Ricks, Morris and Sherry measured the CS of 135 US Navy fighter pilots ranging in age from 24-44 years and compared these to the CS of non-aviators using the Nicolet CS 2000 tester [25]. They correlated the pilot's CS with their airto-air target detection distance measured during air combat manoeuvre training and to their night carrier landing performance scores. The CS functions measured in US Navy jet pilots had an inverted 'U' shape typical of normal human vision and the peak sensitivity was between 1.0 - 6.0 c/d. They found that the mean CS of aviators and non-aviators were within + 1.0 SD of each other and where differences were found these were attributed to methodological and procedural factors. There was also no evidence of relation between CS and air-to-air target detection or night carrier landing performance scores.
It is known that differences in procedural conditions and stimuli can alter markedly the range of CS values in different studies. The characteristics of the normative population being measured and the purpose of application appear to be important factors which determine the reference values that the researcher should use.
Aim of the study
The aim of this study was to characterize IAF aircrew and non aircrew so that CS function in these groups within a restricted age range (20 to 40) years may be estimated in relation to particular viewing conditions.
Methodology
Subjects
Measurements of binocular CS were made in 75 serving IAF aircrew. 50 of these were fighter aircrew and 25 were non-fighter aircrew who reported to Institute of Aerospace Medicine for Medical Evaluation, Training and Indoctrination courses from July 1999 to March 2001. 30 Non aircrew subjects were also tested. The fighter aircrew ranged from age 21-38 years with mean age 26.60 years, (SD 3.96 years). The non-fighter aircrew ranged from age 25-39 years with mean age 31.4 years, (SD 4.75 years). The non aircrew ranged from age 22-36 years with mean age 30.10 years, (SD 4.56 years). None of the pilots wore refractive corrections while flying. One non aircrew subject wore refractive correction and was tested while wearing it. Demographic characteristics of the three samples are shown in Tables 1 to 6.
| Variable | Fighter Aircrew | Other Aircrew | Non Aircrew | ||||||
|---|---|---|---|---|---|---|---|---|---|
| Mean | SD | N | Mean | SD | N | Mean | SD | N | |
| Age (Years) | 26.60 | 3.96 | 50 | 31.40 | 4.75 | 25 | 30.10 | 4.56 | 30 |
| Service (Years) | 5.10 | 4.05 | 50 | 9.36 | 5.12 | 21 | 10.18 | 4.56 | 30 |
| Education (Years) | 15 | .53 | 50 | 14.87 | .63 | 23 | 15.7 | 1.6 | 30 |
| Variable | Fighter Aircrew | Other Aircrew | ||||
|---|---|---|---|---|---|---|
| Mean | SD | N | Mean | SD | N | |
| Total Flying Hours all A/c | 726.02 | 631.53 | 50 | 1713.08 | 911.04 | 24 |
| Flying Hours on Present A/c | 305.33 | 428.91 | 48 | 1145.25 | 635.3 | 24 |
| Night Flying Hours | 68.13 | 92.77 | 47 | 339.74 | 282.43 | 23 |
| Currency (Months Not Flown) | 3.4 | 5.55 | 50 | 3.17 | 5.51 | 24 |
| Present Aircraft | Frequency | Percentage |
|---|---|---|
| MiG21 | 25 | 50 |
| MiG23 | 5 | 10 |
| MiG27 | 4 | 8 |
| MiG 29 | 4 | 8 |
| Mirage 2000 | 3 | 6 |
| Jaguar | 3 | 6 |
| Trainers | ON | 12 |
| Total | 50 | 100 |
| Present Aircraft | Frequency | Percentage |
|---|---|---|
| Transport A/c | 19 | 76 |
| Helicopter | 6 | 24 |
| Total | 25 | 100 |
| Instrument Rating | Fighter Aircrew | Other Aircrew | ||
|---|---|---|---|---|
| No. of Subjects Percentage (N=50) | No. of Subjects Percentage (N=25) | |||
| Unrated | 25 | 50 | 3 | 12 |
| White | 10 | 20 | 2 | 8 |
| Green | 7 | 14 | 6 | 24 |
| Master Green | 5 | 10 | 3 | 12 |
| Subjects | Fighter Aircrew (N=50) | Other Aircrew (N=25) | Non Aircrew (N=30) | |||
|---|---|---|---|---|---|---|
| Fit | Unfit | Fit | Unfit | Fit | Unfit | |
| No | 39 | 11 | oo | 7 | 30 | 0 |
| % | 78% | 22% | 72% | 28% | 100% | 0% |
| Others | 3 | 6 | 11 | 44 | ||
The unfit aircrew suffered from disabilities which do not affect vision such as vertebral fractures and low backache.
Preliminary eye examination
A complete ophthalmological examination was part of the procedure and eligibility for the test. The visual acuity of all subjects tested by Snellen's chart were 6/6 or better. Subjects with medical history of eye disease were not included in the study. None of the subjects had any tropias on cover test. The anterior chamber, posterior chamber, intra-ocular pressure, color vision and visual fields were normal in all subjects. Table 7 shows the visual acuity of the samples.
| Subjects | Fighter Aircrew (N=50) | Other Aircrew (N=25) | Non Aircrew (N=30) | |||
|---|---|---|---|---|---|---|
| more than 6/6 VA 6/6 | more than 6/6 VA | 6/6 more than 6/6 VA 6/6 | ||||
| Number | 31 | 19 | 8 | 17 | 4 | 26 |
| Percentage | 62% | 38% | 32% | 68% | 13% | 87% |
Procedure
CS was measured psychophysical^ with the automated CS function measuring apparatus (Nicolet Optronics, CS-2000) which consists of a cathode ray tube, a control box and a keyboard.
Vertical stationary achromatic sinusoidal gratings of different spatial frequencies (0.5 to 22.8 c/ deg) were generated by CS 2000 CS testing system and displayed on high resolution cathode ray tube. The mean luminance was calibrated with the built-in photo cell calibration system to 100 cd/m2 at the start of each day. During the experiment, the laboratory has no other source of light excepting the display screen. Surround illumination was darkened and at 15 lux. Maximum contrast of the grating was 0.50, the spatial frequency and the contrast of the gratings were controlled by the microprocessor. The display subtended visual angle of 5.59° vertically and 4.30° horizontally at a viewing distance of 3 metres.
The subject was seated in a comfortable position. The written consent and information schedule was filled up by him. The subject was then adapted to the dark room with the display on and was positioned with his eyes at the level of the centre of the screen. Standard instructions were given. Subject's binocular contrast threshold for stationary gratings were then measured in this almost darkened room with natural pupils at 3 metres viewing distance. Response box was held in the hand the subjects said they wrote with.
Contrast thresholds for each spatial frequency grating were measured using Von Bekesy's tracking procedure. In this procedure, each subject received two practice trials with stationary gratings of 0.5 and 6.0 c/deg. Test trials then followed with the spatial frequencies of 0.5, 1.0. 3.0, 6.0, 11.4 and 22.8 c/deg. Preceeding each trial, a preview of spatial frequency grating to be used on succeeding trial was presented at a contrast well above threshold (0.5). A pair of tones signalled the start of the preview period, which consisted of a 1 second increase in the contrast of that spatial frequency from zero to 50%. The 50% contrast level was displayed for 2 seconds, after which the contrast decreased to zero. The preview was shown to reduce observer uncertainty about the appearance of the pattern, a factor known to elevate thresholds. The preview ended with a pair of tones.
A single tone then warned the subject of the start of the actual test trial. The same grating used in the preview appeared initially at zero contrast and increased gradually in contrast in exponentially spaced steps until the subject detected the grating and depressed the push button on a response box. The subject maintained the button in the depressed position as long as the grating was visible. The grating contrast was decreased automatically while the button was depressed and the subject released the button when the grating had disappeared. The contrast then increased automatically again, until the subject again depressed the button. This alternating pattern of increase and decrease continued until four button presses and four button releases had occurred. A tone signalled the end of the trial and the microprocessor then computed the mean and SD of the obtained contrast threshold and printed this data before proceeding to the next trial.
Single threshold determinations were made for each of the eight spatial frequencies. CS functions were plotted during the experimental session so that any anomalous threshold could be probed. The experimenter retested subjects on those frequencies where thresholds deviated more than the estimated normal curve for each subject. This curve was estimated by fitting an inverted “U” shaped function through the data points by eye.
Data reduction
Data of forty two variables, for 105 subjects, were entered into the Statistical Package for Social Sciences (SPSS) worksheet on computer. Eighteen of these variables were demographic characteristics including personal, flying and medical history. Twenty four variables were CS variables. These were the individual Means, SDs, CS threshold and log threshold values for all six spatial frequencies.
Statistical Analysis
Frequency disfrtbutibfis and group percentiles of CS variables and their log values of 50 fighter aircrew, 25 non-fighter aircrew and 30 non aircrew were generated for each of the six test gratings. Kolmogorov D statistics were computed to test for normality of distributions. Students 't' test of differences in CS were computed between the fighter aircrew, non fighter aircrew and non aircrew groups. CS and Pearson's product correlations between CS and spatial frequency, total flying hours and night flying hours in aircrew were done.
Results
Descriptive statistics of the six frequency distributions for 50 fighter aircrew, 25 other aircrew and 30 non aircrew were compiled and all of these distributions were statistically normal, according to the Kolmogorov D statistic.
Comparison between groups
The group mean CS values for the group of 50 fighter aircrew, 25 other aircrew and 30 non aircrew corresponding to the spatial frequencies are shown in Table 8 and depicted in Figure 1.
| Frequency (cpd) | Mean | SD | Mean | SD | Mean | SD |
|---|---|---|---|---|---|---|
| Log CS 0.5 | 23.76 | 9.14 | 21.62 | 13.18 | 23.45 | 6.10 |
| LogCS 1.0 | 61.04 | 35.55 | 66.80 | 45.29 | 59.40 | 24.85 |
| Log CS 3.0 | 228.99 | 89.79 | 204.76 | 73.80 | 181.3 | 53.84 |
| LogCS 6.0 | 226.14 | 85.62 | 198.132 | 54.70 | 183.39 | 57.78 |
| LogCS 11.4 | 117.08 | 60.60 | 98.536 | 41.48 | 91.67 | 34.99 |
| Log CS 22.8 | 32.04 | 20.47 | 27.892 | 19.23 | 25.66 | 8.62 |

- Group means CS values of Fighter Aircrew (n=50), Other Aircrew (n=25) and Control Group (n=30)
Fig. 1 shows the means of the three groups. The graph shows that the mean CS of fighter aircrew sample showed higher values in spatial frequencies 3 to 22.8 cpd as compared to non aircrew and the other aircrew sample. The fighter aircrew values were significantly different from non aircrew in 3,6 and 11.4 cpd as shown in Table 9. Fighter aircrew had almost similar values in spatial frequencies 0.5 to 1 cpd as compared to non aircrew and the other aircrew.
| Spatial Frequency (cpd) | Fighter Aircrew Vs Non Aircrew | Fighter Aircrew Vs Other Aircrew | Non Aircrew Vs Other Aircrew |
|---|---|---|---|
| Log CS 0.5 | 0.24 (.808) | -1.43 (.156) | -1.61 (.112) |
| Log CS 1.0 | 0.15 (.881) | 0.30 (.768) | 0.16 (.873) |
| Log CS 3.0 | - 2.54 (.013) * | - 1.10 (.274) | 1.23 (.224) |
| Log CS 6.0 | - 2.36 (.021) * | - 1.22 (.227) | 1.10 (.274) |
| LogCS 11.4 | - 1.98 (.052) * | - 1.27 (.209) | 0.56 (.576) |
| Log CS 22.8 | - 089 (.374) | - 0.96 (.342) | -0.24 (.811) |
Figure in bracket shows 2-tailed probability values.
It also shows that the mean CS of other aircrew sample showed higher values in spatial frequencies 1 to 22.8 cpd as compared to non aircrew and a lower value in 0.5 cpd spatial frequency as compared to them.
Correlation between flying hours and Spatial Frequencies
Correlation between total flying hours, flying hours on present aircraft and night flying hours with different spatial frequencies showed that there was a significant correlation at spatial frequency of 22.8 cpd for all the three. The total flying hours are correlated with log CS values at 6.0 cpd (p<.04) and 22.8 (p<.01). In addition significant correlation was seen with total flying hours and 6 cpd. This could be due to selection, flying experience or training.
Discussion
Fighter aircrew
The CS functions of our fighter aircrew sample were compared to CS scores of 135 US fighter pilots as reported by Temme et al. [25] because of the similarity of the subjects used in their sample. Fig 2 compares the mean and± 1 SD of our data with that of mean CS values ofTemmeetal.
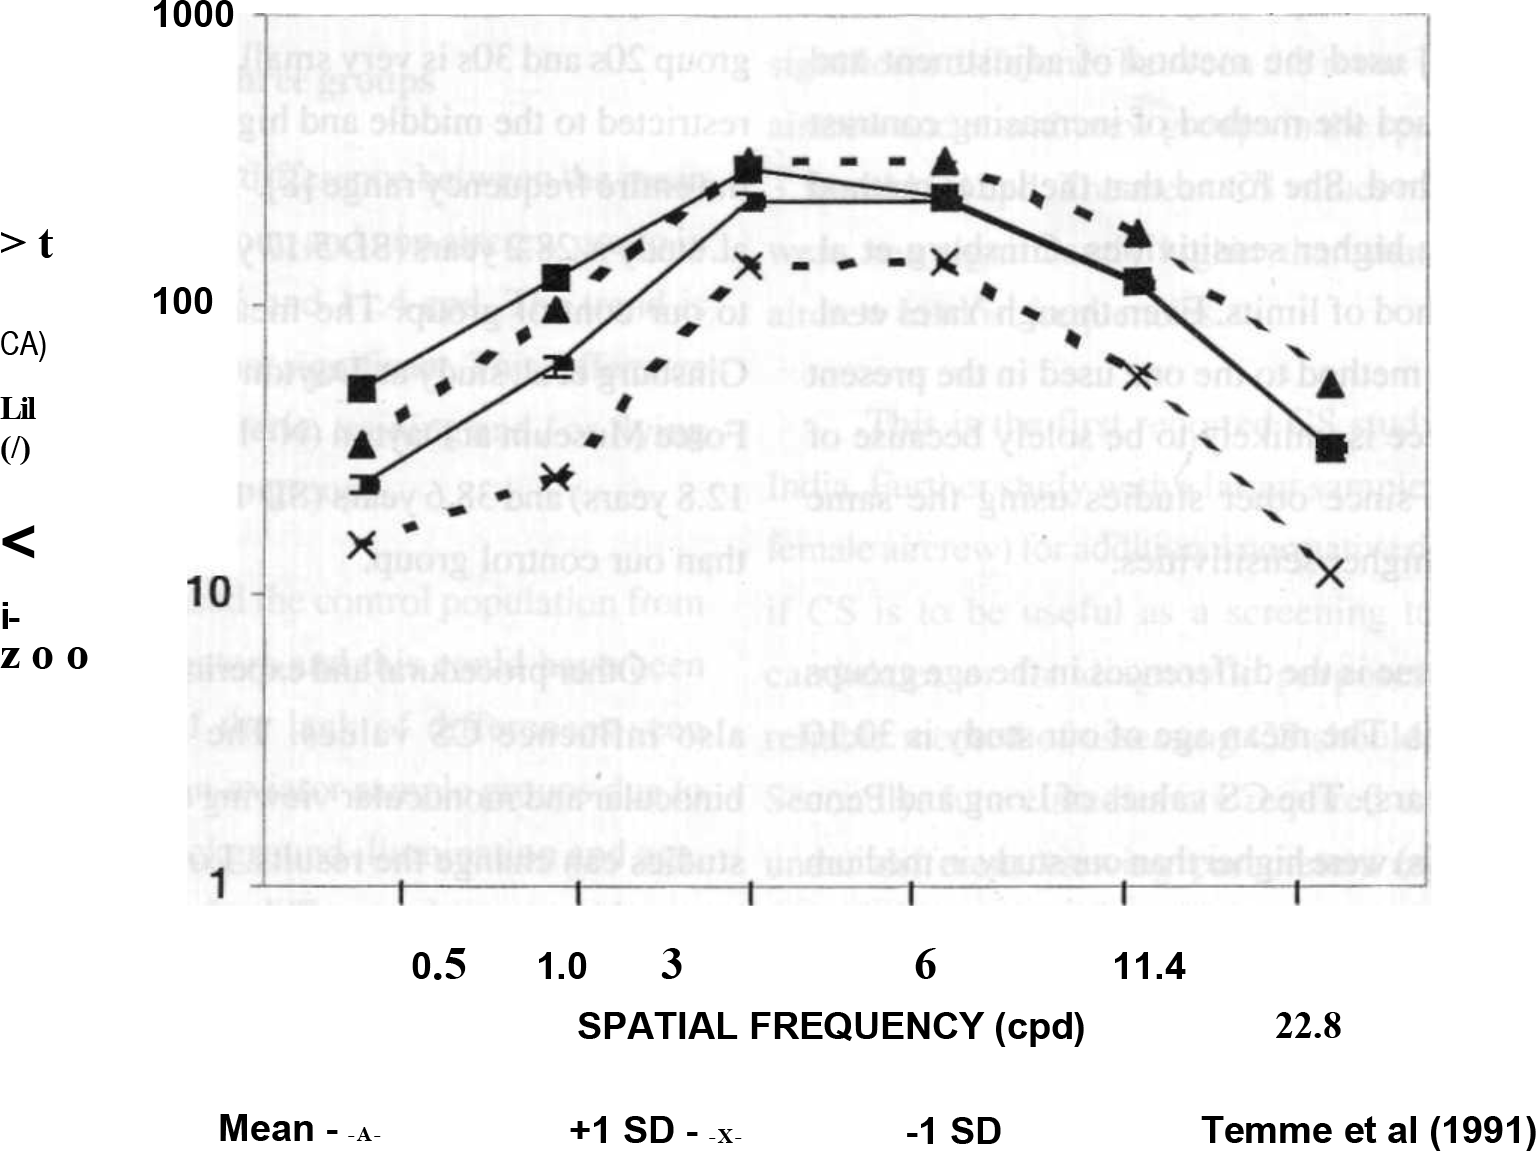
- Group Mean + (SE) and + 1(SD) CS Values of Fighter Aircrew (n=50) and compared with data of Temme et al 1991
Spatial frequency (cpd) is plotted on the graph's horizontal axis and CS is plotted on the vertical axis. The two dotted lines in Figure 2 are +1 SD and -1 SD from the mean of our fighter aircrew sample. The difference between these two lines is relatively constant for all spatial frequencies. Mean CS of Temme et al.'s study is also shown in the figure. As is evident in the graph, Mean CS values in Temme's study are higher in spatial frequencies below 6 cpd and similar in 6 cpd and above. In the two lower spatial frequencies of 0.5 and 1.0 cpd, the means are much higher then our study (outside the ranges of + 1 SD). In the other spatial frequencies, the mean CS of Temme's study falls within the range of + 1 SD of our fighter aircrew sample. The ranges of sensitivity for our fighter aircrew is within one log unit for all spatial frequencies and is much less than the range reported by Temme etal. [25].
The different results between this study and Temme's may be attributed to a number of factors. Even though the mean age of Temme's group was 30.2 years (SD 4.06 years) and our group mean is 26.6 years (SD 3.96 years) this difference is unlikely to be due to age differences between the two groups. Owsley et al. had found that any differences in the CSF between subjects in age groups 20s and 30s is very small and such differences are restricted to the middle and high frequencies and not to the entire frequency range. [8].
It is also known that the greater the contrast between test grating and the surrounding field, the lower the sensitivity to low spatial frequency grating [26]. Therefore, the surround luminance used there can be expected to lower the sensitivity. Other studies cited above used surround fields with much lower contrasts i.e. Temme et al. used surround luminance contrast of 0.29 whereas our study used a surround luminance contrast of 1.0 (dark room). The CS of our group is lower than that of Temme's at lower and medium frequencies and this can be attributed to the differences in surround luminance contrast used.
The other possible reason for this difference may be that the flying experience of their group differing from ours. Since it is the only published study available on pilots, and since there are no details of the mean flying experience of their group, comparisons on aspects of flying experience with the present study are not possible. Temme at al. had suggested that “it is possible that the difference is a result of experience and training which either influences the actual sensitivity to the low frequency stimuli or to the threshold criterion of the subjects during testing” [25].
Temme et al did not find any evidence of a relationship between CS and air-to-air target detection distances or night carrier-landing performance. However there is no mention in their study of controlling the numerous other factors apart from CS, which are likely to influence this task performance [25].
Other aircrew
As no other study on CS is available on non-fighter aircrew, comparisons cannot be drawn. However, the mean CS of the other aircrew was higher than the non aircrew group in medium and higher spatial frequencies (except in the lowest frequency of 0.5 cpd) though these differences are not statistically significant.
When compared to the fighter aircrew, the CS values were lower in all frequencies except 1.0 cpd. No significant difference was found between the fighter aircrew and other aircrew population.
Non aircrew group
The CS mean values of this study are comparable to mean CS values of most other previous studies at all spatial frequencies between 0.5 to 24 cpd. [5,6,8,24,27]. All values on other studies were within + 1 SD of our mean except three values which were marginally outside this range. These three values were in the spatial frequency of 3,6 and 8 cpd. When compared to other studies on different populations the mean CS values are most comparable to those of Yates et al. [6].
Fig 3 shows the Mean and + 1 SD of our study along with the means of other studies [5,6,8,24,27].
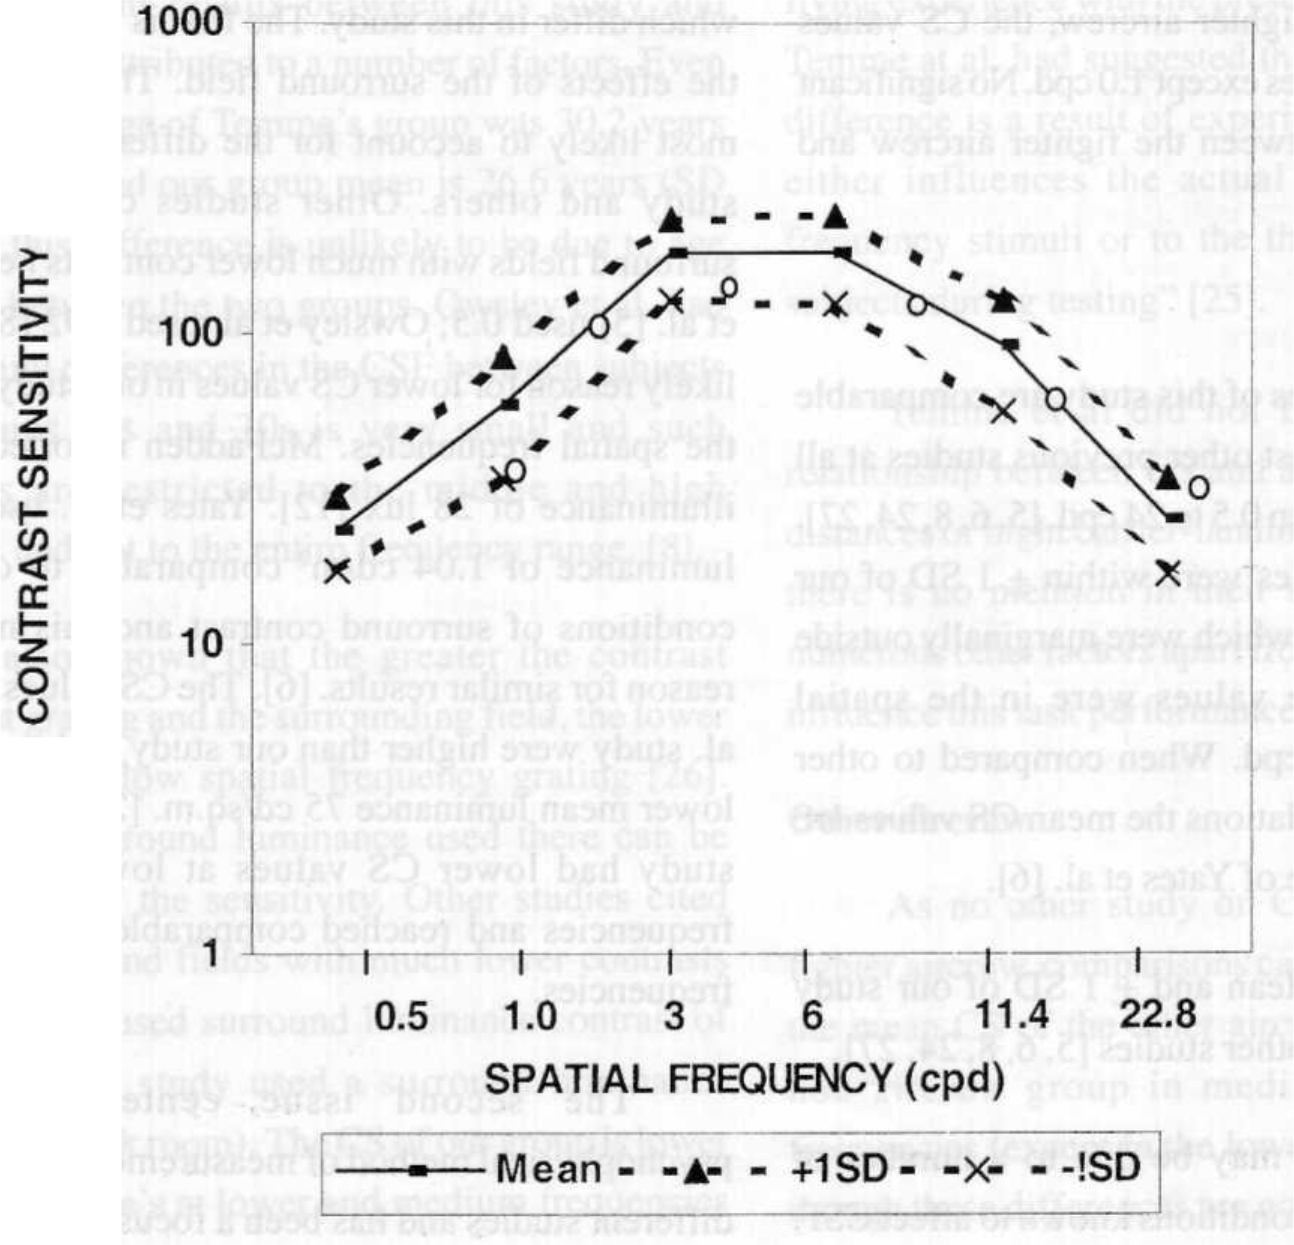
- Group Mean, +1SD CS Values of Control sample(n=30)
These differences may be due to a number of stimulus and procedural conditions known to affect CSF, which differ in this study. The first is likely to be due to the effects of the surround field. This factor appears most likely to account for the difference seen in this study and others. Other studies cited above used surround fields with much lower contrasts i.e. Ginsburg et al. [5] used 0.5; Owsley et al. used 0.92 [8]. This is a likely reason for lower CS values in our study in most of the spatial frequencies. McFadden reported surround illuminance of 28 lux [12]. Yates et al. used a lower luminance of 1.04 cd/m2 comparable to our testing conditions of surround contrast and this may be the reason for similar results. [6]. The CS values of Kelly et al. study were higher than our study and can be due to lower mean luminance 75 cd/sq.m. [27]. Therefore our study had lower CS values at lower and medium frequencies and reached comparable values at higher frequencies.
The second issue centers around the psychophysical method of measurement which varies in different studies and has been a focus of discussion in a number of previous studies. The main issue has been one of use of a criterion free threshold procedure. Long and Penn. [24]. Owsley et al. [8]. Kelly et al. [27] and Yates et al. [6] used von Bekesy's tracking procedure. Temme et al. [25] used the method of adjustment and McFadden [12] used the method of increasing contrast and the 2IFC method. She found that the latter method gave significantly higher sensitivities. Ginsburg et al. [11] used the method of limits. Even though Yates et al. [6] used a similar method to the one used in the present study the difference is unlikely to be solely because of the method used since other studies using the same method reported higher sensitivities.
The third issue is the differences in the age groups in different studies. The mean age of our study is 30.10 years (SD 4.56 years). The CS values of Long and Penn (mean age early 20s) were higher than our study in medium and higher frequencies and this can possibly be attributed to the age difference between our study and theirs.
The mean age of Kelly et al. [27] study is 24.8 years (SD 3.9 years). Difference in CS values in the higher frequencies were not observed. Owsley had also found that any differences in the CSF between subjects in age group 20s and 30s is very small and such differences are restricted to the middle and high frequencies and not to the entire frequency range [8]. The mean age of Yates et al. study is 28.2 years (SD 5.17 years). This is comparable to our control group. The mean age of two groups of Ginsburg et al. study at Dayton Air fair (N=125) and Air Force Museum at Dayton (N=140) were 35.9 years (SP 12.8 years) and 38.6 years (SD 14.5 years). This is higher than our control group.
Other procedural and experimental differences may also influence CS values. The differences between binocular and monocular viewing conditions in different studies can change the results. Long and Penn [24] had studied monocular visual CS. The absence or presence of training effects on CS as measured with the Nicolet system may affect CS scores [27]. This study used naive subjects, and according to Long and Penn, the first run significantly underestimates CS [24].
Comparison between the three groups
There is a significant difference between the mean values of fighter aircrew group and non aircrew group in the spatial frequencies 3, 6 and 11.4 cpd. The trend is similar in 22.8 cpd also but not significant. This difference may be due to selection criteria, training and / or flying experience between the two groups.
Temme [25] had used the control population from studies of other investigators and this could have been a contributing factor of the lack of differences seen between aviators and non-aviator sample groups due to different procedures, background illumination and age. However, he also reported a difference between aviators and non-aviators to 0.5 cpd stimuli which he opined may be “due to the influence of some previonsly unrecognised selection factor responsible for a differential rejection or attrition of individuals with lesser CS to the lower frequency stimuli”.
The mean CS values of fighter aircrew were higher than that of other and non aircrew groups in most frequencies except 1 cpd where other aircrew were higher than the two other groups.
Conclusion
Previous research has reported the usefulness of contrast sensitivity (CS) as a measure of visual capability in aircrew. The purpose of this study was to gather comparative data on an Indian aircrew and non aircrew population. Aircrew comprised fighter and non fighter sub groups. Psychophysical measurements of binocular contrast threshold were made in 75 aircrew and 30 non aircrew (20-40 years) with the automated CS measuring apparatus, Nicolet Optronics CS-2000 at spatial frequencies within the range of 0.5 to 22.8 cpd. All subjects had visual acuity of 6/6 or better in both eyes.
Individual CSFs, variability and correlations between frequencies followed the standard trends in both groups. The mean CS values of aircrew were higher than that of non aircrew in all frequencies. There was a significant difference between the mean values of fighter aircrew and non aircrew groups in the spatial frequencies 3,6 and 11.4 cpd. The mean CS values of fighter aircrew were non significantly higher than that of non fighter aircrew in most frequencies.
This is the first reported CS study on aircrew in India. Further study with a larger sample size (including female aircrew) for additional normative data is necessary, if CS is to be useful as a screening tool for aircrew candidates or for diagnostic purposes. A short but reliable method of assessing CS should be considered. Secondly, future studies are required to outline norms under different viewing parameters especially under simulated conditions of aerospace operational environments. The validity of CS for predicting performance on visual tasks needs to be assessed to substantiate previous research findings.
Acknowledgement
This research was supported by AFMRC Project No. 2126/96. The paper is based on the research presented by the first author to RGUHS, in partial fulfillment of the requirements for MD degree in Aerospace Medicine (2001) and guided by the second author.
References
- Proposed new vision standards for the 1980s and beyond : Contrast Sensitivity. In: NTIS Reports. 1981. AFAMRL-TR-80-121
- [Google Scholar]
- Manual of Medical Examinations and Medical Boards IAP-4303. (2nd Ed). Air HQ: New Delhi; :2-12-5. Appendix - “B”
- [Google Scholar]
- A system for controlled presentation of the Arden contrast sensitivity test. Aviation Space and Environmental Medicine. 1988;59(7):667-669.
- [Google Scholar]
- Large sample norms for contrast sensitivity. American Journal of Optometry and Physiological Optics. 1984;61(2):80-84.
- [Google Scholar]
- Contrast sensitivity : characteristics of a large, young, adult population. American Journal of Optometry and Physiological Optics. 1987;64(7):519-527.
- [Google Scholar]
- Bodis-Woller I Detection of visual defects using the contrast sensitivity function. International Opthamological Clinics. 1980;20(l):235-253.
- [Google Scholar]
- ME Contrast sensitivity, acuity and the perception of real world targets. British Journal of Opthamology. 1987;71:791-796.
- [Google Scholar]
- The measurement of contrast sensitivity in aircrew candidates. DC1EM Report No 87-RR-04. Defence and Civil Institute of Environmental Medicine, North York, Ontario.
- [Google Scholar]
- A new contrast sensitivity vision test chart. American Journal of Optometry and Physiological Optics. 1984;61:403-407.
- [Google Scholar]
- A comparison of two contrast sensitivity tests and their usefulness as a screener for aircrew. Aviation Space and Environmental Medicine. 1994;65:710-717.
- [Google Scholar]
- Contrast sensitivity predicts pilots' performance in-aircraft simulators. American Journal of Optometry and Physiological Optics. 1982;59:105-109.
- [Google Scholar]
- Contrast sensitivity predicts age related differences in highway sign discriminability. Human Factors. 1985;27:637-642.
- [Google Scholar]
- Contrast sensitivity as a predictor of complex target detection. In : Proceedings of the Human Factorys Society, 31st Annual Meeting. Santa Monica, CS: Human Factors Society; 1987. p. :1194-1196.
- [Google Scholar]
- Flying performance on the advanced simulator for pilot training and laboratory tests of vision. Human Factors. 1983;25:457-466.
- [Google Scholar]
- Visual test results compared with flying performance in telemetry tracked aircraft. Aviation Space and Environmental Medicine. 1983;54:906-911.
- [Google Scholar]
- Contrast sensitivity and target detection performance : a lack of correlation. In: In : Society of Information Display 87 Digest of Technical Papers. New York: Palisades Institute for Research Services Incorporated; 1987. p. :127-129.
- [Google Scholar]
- Visual information processing based on spatial filters constrained by biological data NTIS Reports. AFAMRL-TR-78-129 Vols I and II
- [Google Scholar]
- Direct performance of HUD systems using contrast sensitivity. In: Martin WL, ed. Optical and human performance evaluation of HUD systems design. Wright-Patterson. AFB, OH: USAF AMRL; 1983. p. :55-56.
- [Google Scholar]
- Further investigation of visual acuity and contrast sensitivity in pilot detection of aircraft In : Proceedings of the Human Factors Society, 31st Annual Meeting. Santa Monica, CA: Human Factors Society; 1987. p. :1189-1193.
- [Google Scholar]
- Reduced contrast sensitivity when viewing through an aircraft windscreen. Aviation Space and Environmental Medicine. 1991;62:254-257.
- [Google Scholar]
- Comparative performance of aviation filters on human contast sensitivity function AMRL-TR-73-13. Bloomington Division of Optometry and Department of Physiological Optics, Indiana University.
- [Google Scholar]
- Spatial contast sensitivity through aviator's night vision imaging system. Aviation Space and Environmental Medicine. 1993;64(8):706-710.
- [Google Scholar]
- Normative contrast sensitivity functions : the problem of comparison. American Journal of Optometry and Physiological Optics. 1987;64(2):131-135.
- [Google Scholar]
- Visual contrast sensitivity of U.S. Navy jet pilots. Aviation Space and Environmental Medicine. 1991;62:1032-1036.
- [Google Scholar]
- Effects of average luminance surrounds on the visibility of sine wave grating Journal of the Optical Society of America. . 1980;70:212-219.
- [Google Scholar]
- Effect of repeated testing on contrast sensitivity. American Journal of Optometry and Physiological Optics. 1987;64(4):241-245.
- [Google Scholar]


